
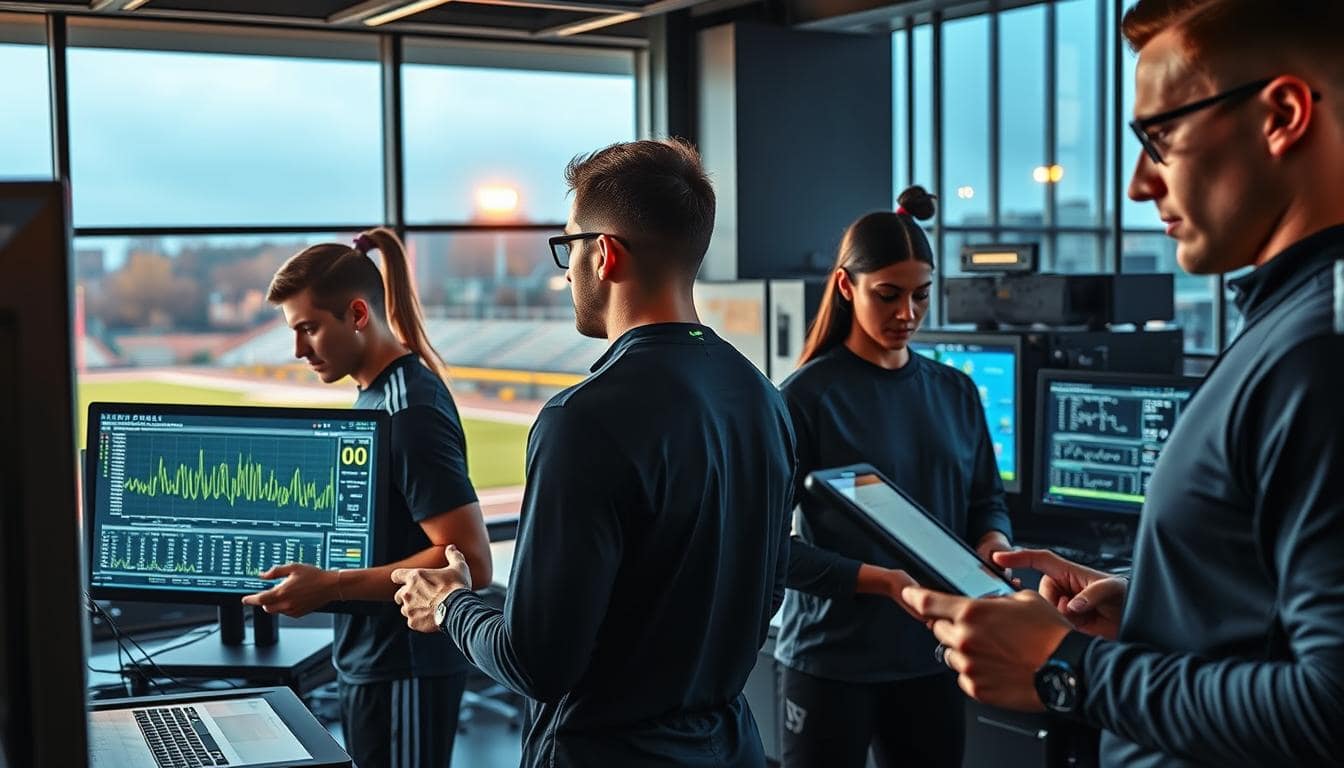
In the world of sports analytics, things have changed a lot. No longer do coaches just use a clipboard and a stopwatch. Now, we have a huge amount of data to work with. Over 6,000 studies have been done, with 51 focusing on deep learning in sports.
This isn’t just about numbers; it’s about understanding what they mean. We have data from many sources, like visual inputs and heart rate monitors. Each one helps us see how well athletes are doing.
Joe Larkin from ASM-Rugby says the real challenge is making sense of all this data fast. With tools like Catapult’s Vector S7/T7, we can track athletes’ movements and effort in real-time. But with so much data, it’s hard to keep up.
We’re at a key point where understanding complex data is just as important as collecting it. We’re using advanced tools like Opta data to turn numbers into useful insights. So, are you manually coding match footage? It’s time to join the revolution.
Signal processing and filtering techniques
In sports analytics, signal processing is key. It filters out the noise to show us what’s important. Think of it like finding the real message in a crowded press conference.
Deep learning is a big help here. It automatically pulls out useful info from sensor data. Convolutional Neural Networks (CNNs) are great for images, and 3D-CNNs work in three dimensions, perfect for analyzing movement.
Recurrent Neural Networks (RNNs) and Long Short-Term Memory networks (LSTMs) are top for handling data over time. Traditional 2D-CNNs are good but can miss the timing in videos. This is why new mixtures of models are being used.
Hybrid CNN-LSTM models are showing great results. They mix spatial and temporal analysis to spot patterns well. This lets us see not just where a tennis serve is but also how it moves.
Without good filtering, we might think too much data is useful. In sports, we need to be careful. Our athletes deserve real data, not just show.
| Technique | Application | Advantages |
|---|---|---|
| CNN | Image data processing | Efficient spatial feature extraction |
| 3D-CNN | Video data analysis | Captures spatial-temporal relationships |
| RNN | Sequential data handling | Models temporal dependencies |
| LSTM | Long sequences | Prevents vanishing gradient problem |
| CNN-LSTM Hybrid | Complex pattern recognition | Combines spatial and temporal analysis |
Machine learning algorithms for pattern recognition
Imagine a coaching world where machine learning makes a big difference. It’s not just about fancy algorithms; it’s a major change in how we look at performance data. In sports, machine learning is key for spotting patterns. It breaks down plays like a pro coach, looking at everything from how players move to when injuries might happen.
Deep learning, like Convolutional Neural Networks (CNNs) and Recurrent Neural Networks (RNNs), leads this change. CNNs are great at recognizing images, perfect for reviewing game footage. RNNs, like Long Short-Term Memory networks (LSTMs), get the flow of a game, giving insights humans might miss.
The field is moving from just talking about algorithms to making them useful for coaches. This shift is shown in keyword analysis, focusing on image recognition, computer vision, and sport-specific analysis. These areas are opening up a new world of data-driven coaching.
So, what does this mean for sports? Picture a basketball game where algorithms can tell you not just what happened but how well it was done. Was that pick-and-roll perfect or a bit off? The answer is in the data.
Data-driven coaching isn’t about replacing coaches; it’s about making them better. It’s like having a never-tired research assistant who can analyze opponents while you enjoy your coffee. The real question is, are you ready to use the insights machines offer?
| Technique | Application | Strengths |
|---|---|---|
| CNNs | Visual Recognition | High accuracy in image analysis |
| RNNs | Temporal Sequence Analysis | Excellent for time-based data |
| LSTMs | Performance Prediction | Handles long-term dependencies |
Real-time feedback systems design
Imagine being in a high-stakes game where every second matters. Real-time feedback systems are key in sports analytics, giving instant insights. These systems do more than collect data; they offer actionable advice right when it’s needed.
Real-time analytics tools give detailed looks at speed, distance, and effort. Wearables like GPS and heart rate monitors track how your body responds. For example, the NBA uses Sony’s Hawk-Eye Innovations for fast 3D tracking. This tech captures player and ball movements almost instantly.
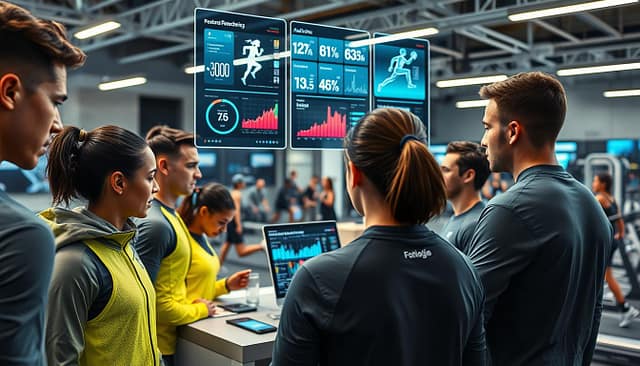
But there’s more. PlaySight© brings instant video feedback to tennis, showing stroke speed and ball placement. It’s like having a personal data expert, giving you real-time insights. Catapult’s Vector S7/T7 wearables also change how we monitor athletes, turning it into a live dashboard.
But there’s a catch. Sports analytics isn’t just about tech; it’s also about psychology. How do you share insights without overwhelming athletes and coaches? I’ve seen coaches get so caught up in data they forget about the athletes. This is where the challenge is: finding the right balance between data and intuition.
As we design these systems, we must think about how to improve performance without distraction. It’s a fine line, but it’s essential for unlocking athletes’ full abilities. For more on wearable technology in sports, check out this article on wearable technology in sports equipment.
Performance visualization dashboards
Performance metrics can be dull, but visualization dashboards bring them to life. These dashboards are more than just pretty pictures. They turn raw statistics into compelling stories. In sports analytics, where time is of the essence, quick insights are key.
Cloud-based platforms have changed how teams and athletes share information. They make it easy to share playbooks, video analyses, and tactical plans in real-time. No more endless emails with data that only experts can understand. Instead, we have dashboards that show performance data analytics in a way that’s both informative and engaging.
Imagine seeing biomechanical inefficiencies as heat maps and trajectory overlays. Advanced systems like IBM Watson’s Sports Performance Analytics find patterns and predict outcomes. This turns data into visual insights, helping coaches make quick decisions.
The best dashboards tell a story with a clear beginning, middle, and end. They show trends and performance metrics, giving context that raw data can’t. On the other hand, bad dashboards can confuse, looking like a mess of widgets.
Do your dashboards show insight or just confuse? It depends on how well they tell the story behind the numbers. By focusing on performance metrics and showing them visually, we can change how athletes and coaches use their data.
Predictive modeling for injury prevention
Think of predictive modeling as your digital coach, seeing injuries before they happen. In sports, it’s not just tech talk; it’s key for injury prevention. Deep learning helps us find patterns in data that we might miss.
CNN-LSTM models are at the core of this tech. They mix spatial and temporal analysis to spot small changes that could lead to big injuries. It’s like having a forecast for your hamstrings, which is both amazing and a bit scary.
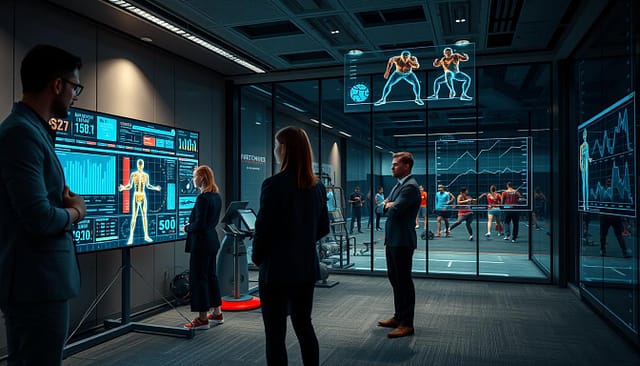
Companies like IBM Watson’s Sports Performance Analytics and Megalabs AI lead this field. They use big data to predict performance and suggest changes. Their algorithms warn of risks from too much training, helping coaches before athletes feel tired.
- Data-driven coaching is not just a luxury; it’s becoming a moral obligation.
- Algorithms can predict injuries with impressive accuracy, but they also carry a risk of false positives.
- Are we prepared to rest our star athlete based on a mere probability?
This raises big questions about our trust in technology in sports. Predictive modeling is more than a tech challenge; it’s about how much we trust machines with our bodies. As we explore this new area, talking about Performance Data Analytics and athlete safety is more important than ever.
Benchmarking and comparative analysis
Benchmarking in sports analytics is more than just a buzzword. It’s a reality check we all need. A review of 51 studies showed big differences in data quality and how models are tested. Many studies found deep learning improved performance, but we need to standardize things more.
There are two main ways to analyze performance: technical analysis and tactical analysis. Old methods like watching videos and using sensors often don’t work well in real time. This makes us wonder if we’re really making sport-specific tools or just improving our basic understanding.
The “Moneyball” story shows how data can challenge old ways of scouting. Billy Beane used data to find market gaps. Today, we need to be just as honest with our data. How does your athlete’s work compare to the league’s? To past injury records? To winning metrics?
Without clear standards, we might just be playing with numbers from GPS trackers. Sports analytics needs standardization to show what really works. It’s time to see benchmarking as a way to check our data honestly.
Integration with training periodization
The move from instinctual training to data-driven methods is both exciting and challenging. Coaches now need to mix their skills with tech, making choices that are both smart and personal. The best strategies combine human intuition with technological precision.
Adding performance metrics to training plans can get complex. Wearables track how much athletes are doing, and AI predicts when they need rest. But, if coaches treat periodization like math, they might miss the human side.
Studies highlight the importance of mentorship and emotional smarts in coaching. Too much tech can weaken these skills. This might lead to plans that don’t fit each athlete’s needs. Remember, performance metrics might say an athlete is ready, but personal issues can change that.
Are you using tech to guide your training plans, or is it controlling you? The best approach is a dialogue between coach, athlete, and data. It should be a team effort, not a one-way rule.
| Aspect | Traditional Approach | Data-Driven Approach |
|---|---|---|
| Decision Making | Intuitive | Data-Driven |
| Coaching Style | Personalized | Standardized |
| Emotional Intelligence | High | Potentially Low |
| Performance Metrics | Qualitative | Quantitative |
In conclusion, using Performance Data Analytics in training should make coaching better, not replace it. The bond between coach and athlete is key, and tech should help strengthen that bond.
ROI measurement for performance systems
Tracking systems and data analysts cost a lot. You’ve spent a lot on technology, but the big question is: does it really help athletes perform better? Data-driven coaching should lead to real results, not just cool stats.
Measuring ROI for performance systems needs a clear approach. Saying “the data is cool” or “coaches like the insights” isn’t enough. What really matters is winning. Has injury rates gone down with predictive modeling? Are tactical changes based on data leading to more wins? These are the key metrics.
Deep learning has shown great promise in athlete monitoring and motion tracking. But we must be careful. Just because it’s promising doesn’t mean it works. Future research should aim to combine different data types and improve real-time analytics. Coaches need systems that help them coach better, not replace them.
If you turned off all the technology tomorrow, would your coaching be better? Or would you see you’ve been relying on expensive tools? The systems that truly pay off are those that help coaches make better decisions. This benefits athletes and their performance.
In the end, performance data analytics should prove their worth by improving results. It’s time to really check if our investments are making the game better.