
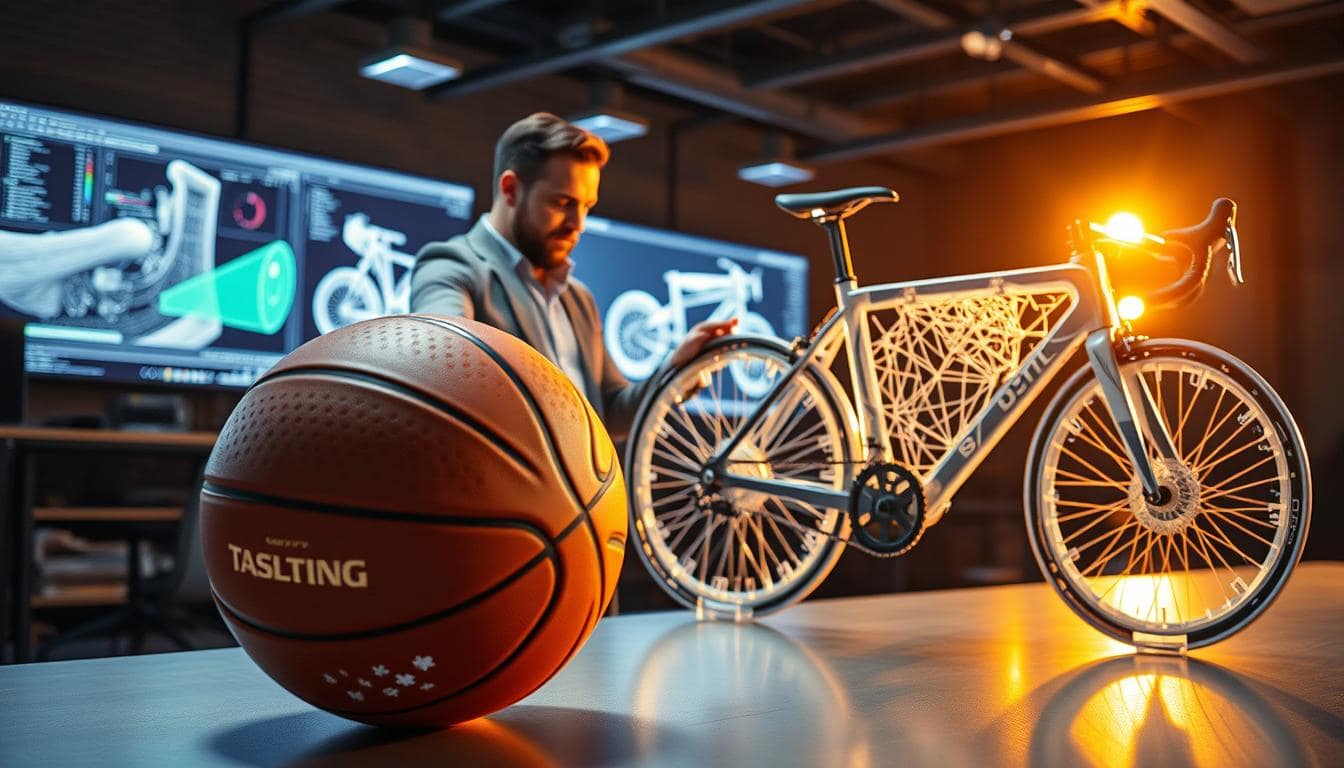
There’s a gap in performance gear. A shoe that looks perfect on a screen can be painful to wear. We can design the best-looking shoes on a computer, but they might not work well in real life.
This is the main challenge in sports engineering today. We have generative design and computer-aided engineering (CAE) on one side. Software like Siemens NX and Autodesk Fusion 360 create amazing designs. They use algorithms for topology optimization, making things lighter and stronger.
But, the human body doesn’t work like a perfect digital model. It gets tired and fails in unexpected ways. This is where the digital model, or digital twin, faces its biggest test: a real, sweaty human.
This process is not just about the algorithm. It’s about the human touch. Finite Element Analysis (FEA) can predict failures, but it can’t simulate the feel of a shoe on a long run. The digital twin is a rehearsal, but testing on a human is the real show. This article says that generative design in sports truly shines when we treat the athlete’s body as the final, key piece of software.
Translating User Needs into Metrics: From Vague Feelings to Hard Data
Every athlete has felt that perfect shoe, like an extension of their body. But when designers ask for “more comfort” or “better stability,” it’s like speaking a foreign language. The first failure point in creating elite sports gear is in translation.
Designers must decode the “voice of the athlete,” not just listen. A trail running shoe might pass lab tests but fail on real trails. The issue wasn’t the shoe’s construction but the wrong definition of “stability.”
The art of engineering meets the science of human factors here. An athlete might say, “I need to feel locked in.” Our task is to understand this in a scientific way.
- Reduced calcaneal eversion (the inward roll of the heel) to under 8 degrees during a 30-degree cut?
- Forefoot splay of less than 2mm under 800N of lateral force?
- Or a subjective rating of “lockdown” that correlates to a specific lace tension measured in newtons?
Design of Experiments (DOE) is key here. It helps us focus on the critical few metrics that define “comfort” or “stability.” This way, we can measure them with sensors.
Consider an athlete who wants more spring in their step. The detective work starts here. Is that:
- Energy Return: Measured in lab as the percentage of energy returned on impact (e.g., 75% energy return in the midsole foam).
- Perceived Effort: A psychological metric correlating to a specific foam compression/rebound curve.
- Acoustics: The literal “spring” sound of the midsole, which influences perceived performance.
This is where we build the correlation between human sensation and instrumented data. We run a DOE to measure foam density, midsole geometry, and plate stiffness. Then, we correlate this with athlete feedback on “springiness.”
So, when an athlete needs “more protection,” don’t just make the foam thicker. Ask: protection from what? From whom? Is it impact protection (measured in g-forces on a sensor in a helmet), abrasion protection (measured in fabric denier and Taber abrasion cycles), or thermal protection (measured in CLO value and breathability)? Each is a quantifiable, testable, and, most importantly, actionable metric.
This translation from human experience to testable parameters is key to innovation. It’s the difference between building a shoe and solving a runner’s problem. The DOE for a new trail shoe isn’t just about foam compounds; it’s a framework for translating human performance into engineering language.
Protocol Design: The Art of Engineering a Better Crucible
If your gear doesn’t fail in the lab, it will on the field. Protocol design is more than checklists. It’s using the scientific method for product development. It’s about making a product fail in a controlled way before it does in real life.
This is where digital designs meet physical challenges. It turns virtual optimizations into real-world tests of stress and strain.
Crafting the Crucible: From Lab to Field Test
Going from digital models to real-world tests needs a translator. The validation protocol is that translator. It’s like a script for the experiment, outlining every action and measurement.
A bad protocol is like a bad movie script. The test is predictable, the test subjects are one-dimensional, and the data is known. We aim to create a thrilling test that pushes the product to its limits.
Forget generic tests like running on a treadmill. Different sports require different movements. For example, a trail running shoe needs to handle lateral cuts and descents, while a cycling shoe must handle explosive sprints and sustained climbs.
Designing a correlation between lab tasks and real-world movements is key. You’re not just testing a shoe; you’re testing a cutting shoe or a jumping shoe.
Intensity: How Hard is Hard Enough?
Simulating a game-winning three-pointer is different from replicating a football match. Intensity is not just yes or no. A good protocol tests extremes, from max-effort sprints to glycogen-depleted fatigue states.
Does your padding protect on the first impact or the hundredth? Does the material breathe when the athlete’s core temperature is at its peak? Intensity is about force, duration, repetition, and material fatigue.
The N of 1 vs. The Power of N
A sample size of one is an anecdote, not data. Three data points is a “trend” for the brave or foolhardy. The power of N is everything.
A robust DOE uses statistical power analysis to determine the needed sample size. This turns good data into a strategic asset.
Surrogate models shine here. Instead of physically testing 500 helmets, we use sensor data from a well-designed DOE. This model predicts failure points for thousands of designs in minutes, showing the correlation between design tweaks and performance under stress.
The table below contrasts old, anecdotal testing with a modern, data-driven approach:
| Aspect | Old-School Anecdotal Testing | Modern, Protocol-Driven Validation |
|---|---|---|
| Sample Size Logic | “Three should be enough.” | Statistically-powered N, defined by power analysis. |
| Task Design | Generic (e.g., “run on a treadmill”). | Sport-specific movement lexicon. |
| Intensity | Static, single-level load. | Spectrum from sub-maximal to failure, simulating game conditions. |
| Data Output | Pass/Fail for the product. | Rich dataset for predictive surrogate models. |
| Goal | Check a box for compliance. | Generate predictive correlation models for future design. |
A great protocol doesn’t just validate; it teaches. It shows not just if a product will fail, but how and why. It creates a feedback loop between digital design and real-world physics. It turns a simple test into a tool for better design.
The Instrumentation Stack: From Motion Capture to Muscle Memory
Generative design and CAE are like the architects of new sports gear. The instrumentation stack is like the inspector, surveyor, and engineer all in one. It checks if your design works in real life.
Until you test it on real people, your design is just a guess. The lab becomes a stage, and our tools are the stars. They work together to gather precise data.

The Sensor Symphony: From MoCap to Muscle
A single athletic move is like a story. But you need many narrators to understand it. The force plate shows the “what” by measuring force.
The optical motion capture system maps the “how” of movement. The EMG whispers the “why” by showing muscle activity. Getting these tools to work together is key to understanding performance.
The Gold Standard: Optical Motion Capture
Motion capture is like the diva of the field. It uses high-speed cameras to track markers with great precision. This system gives you the most accurate data on movement.
When you add a parametric CAD model to the software, you can see how it performs. It’s like having X-ray vision for your design before making a prototype.
The Inertial Workhorse: IMUs
IMUs are like the character actors of the field. They measure movement and orientation, even where the lab can’t go. They provide valuable data in real-world situations.
The Ground Truth: Force Plates & Pressure Mats
Force plates are the truth-tellers of the field. They show what the body does, not just how it moves. They measure forces like a basketball player’s landing.
A recent biomechanics study shows their importance. Without them, data is just animation. They help us understand the real forces at play.
Listening to Muscles: Surface EMG
EMG is like the gossip of the field. It listens to muscles and tells us why they move. It shows if muscles are working efficiently or not.
It helps us see if a golf swing is powered by the right muscles. Or if a runner is using the wrong patterns, leading to injury.
| Instrument | What It Measures | Key Strength | Role in the Biomechanical Trinity |
|---|---|---|---|
| Optical Motion Capture | 3D Position & Movement | High-fidelity spatial tracking | The “How”: The Cartographer. Maps the precise kinematics of movement. |
| IMUs (Inertial Measurement Units) | Acceleration, Orientation | Portability & Context | The “Where & When”: The Workhorse. Provides motion data beyond the lab, in the real world. |
| Force Plates / Pressure Mats | Ground Reaction Forces | Objective Kinetic Data | The “What”: The Stoic Truth-Teller. Measures the unvarnished forces at play. |
| Surface EMG | Muscle Activation | Neuromuscular Intent | The “Why”: The Insider. Reveals the nervous system’s strategy for movement. |
The final score from these sensors is not just charts. It’s about asking a parametric CAD model questions. Like how stiffening a midsole affects muscle activation.
You can simulate real athlete data, not just theoretical loads. This is where digital design meets real-world performance. The goal is to tell a story of human movement, one sensor at a time.
Data Quality & Repeatability: The Unsexy, Non-Negotiable Bedrock
Your digital twin’s quality depends on the data it gets. Even with advanced models, bad data makes your digital twin useless. This part is about making sure your data is perfect.
It’s not about fancy AI or CAD models. It’s about making sure every piece of data is accurate. If not, your expensive prototype might fail for a simple reason: bad data.
Garbage In, Gospel Out: The Sanctity of the Signal
In sports gear, we deal with real data from athletes. This data comes from sensors and cameras. It’s like translating a poem into numbers.
Using an IMU or a high-speed camera means you promise to accurately capture the world. If you break this promise, your work is based on false hopes.
Think of a force plate that’s not set up right. It’s like a scale that changes weight randomly. Designing shoes based on such data is pointless.
The goal is to get truth from your data. The correlation between your digital twin and real data is key. But, if your data is off, it’s all for nothing.
Calibration is essential, like a pre-flight check. It’s needed for IMUs and motion capture systems. A small mistake can ruin your data.
An IMU needs calibration to avoid “drift.” This small error can grow over time. It’s like a compass vs. a spinning top.
The Silent Killer: Filtering Your Data (Without Losing Your Soul)
Raw data is full of noise. Your force plate feels many things, not just the impact. It’s like trying to hear a song in a busy room.
EMG electrodes pick up many signals, not just muscle activity. They also catch electrical noise. Filtering is key to removing this noise.
Filtering is like surgery. You need to remove unwanted signals without losing important ones. A bad filter can ruin your data. You’re aiming for a true signal, not a “clean” one.
Without clean data, your findings are just a lie. You’re not validating your gear; you’re telling a story you want to believe.
Inclusive Testing: Beyond the One-Size-Fits-All Mannequin
The sports equipment industry has long been flawed. For years, we’ve designed for a mythical 25-year-old, 50th-percentile male athlete. This isn’t just a diversity issue; it’s a design flaw. If your test subjects are all similar, your product will fail those who need it most.
True innovation in gear isn’t just about lighter, stronger materials. It’s about designing for the entire spectrum of human performance. This is where topology optimization and parametric CAD tools come in. They help us design for the messy, beautiful reality of human diversity.
Beyond the 25-Year-Old Male Mannequin
The 25-year-old male prototype is a manufacturing defect in the sports gear world. It’s a convenient, cost-effective fiction. Designing for only this demographic is like making a car for driving only straight on sunny days.
Real-world performance is messy, unpredictable, and varied. When we test only on a narrow demographic, we optimize for a ghost. The resulting gear is a compromise that fits no one perfectly. It’s like tailoring a suit for a mannequin and expecting it to fit an entire city.
Generative design and parametric CAD tools change the game. They don’t just design for a single, static point in the human spectrum. They allow us to define a design space.
Think of it this way: instead of designing a single, fixed shape for a helmet or a shoe last, we define the rules—the forces, the safety factors, the material constraints. The algorithm then explores thousands of iterations, creating structures that are optimized for a range of inputs. We can now ask the software: “Give me the strongest, lightest structure that fits this range of head sizes and impact forces.” This is the key to moving from a single, mythical “average” to a spectrum of performance.
The Myth of the “Average” Athlete
The “average” athlete is a statistical ghost. Designing for the average is, by definition, designing for no one. Human bodies and abilities exist on a bell curve, and the “center” is a no-man’s-land. True inclusive testing shatters this myth by populating the test lab with real-world diversity.
This means testing with athletes of different:
- Gender & Physiology: The biomechanics of a female athlete differ from a male athlete of the same sport, affecting stress points, impact distribution, and even thermal regulation. Gear must adapt.
- Body Types & Sizes: The 5th percentile female to the 95th percentile male represent vastly different structural and fit requirements. A one-size-fits-all design will fail both.
- Age & Ability: A 16-year-old’s joint flexibility and a 60-year-old’s performance needs are worlds apart. A 45-year-old weekend warrior has different impact and recovery needs than a professional in their prime.
Consider the following comparison of a traditional vs. an inclusive testing protocol:
| Aspect | Traditional Testing (Exclusive) | Inclusive Testing Paradigm |
|---|---|---|
| Test Subjects | Primarily young, male, elite athletes. | Diverse in age, gender, body type, ability, and skill level. |
| Design Focus | Optimizing for a single, “ideal” user. | Optimizing for a range of users within a defined design space. |
| Data Input | Limited biomechanical data from a narrow cohort. | Rich, multi-variate data from a diverse subject pool. |
| Outcome | Gear that fits a stereotype. | Gear that can be parametrically adapted for a wider market. |
Adaptive & Para-Athlete Protocols: A New Frontier
If inclusive testing is the new frontier, then adaptive and para-athlete protocols are the vanguard. This isn’t about niche design; it’s the ultimate stress test for universal design principles. An athlete using a wheelchair or a prosthetic isn’t a problem to be solved by a niche product; they are the ultimate beta-testers for universal design.
Designing for a sprinter with a prosthetic limb, for instance, forces engineers to rethink the entire kinetic chain. How does the socket interface with the carbon fiber blade? How is impact and vibration dampened differently? The parametric CAD models and topology optimization tools thrive on these constraints. We can now simulate the unique gait of a runner with a prosthetic, or the specific weight distribution of a wheelchair athlete in a custom racing chair. This isn’t just “making a product for disabled athletes.” It’s about solving the most complex problems, which in turn yields better, more robust, and more adaptable solutions for everyone.
This new frontier demands new metrics. We move beyond simple speed or strength metrics to measure:
- Interface Pressure: For prosthetics and orthotics, how does the gear-skin interface perform under dynamic load?
- Energy Return & Dampening: How does a prosthetic foot or a custom wheelchair frame return or absorb energy differently than a biological limb?
- Thermal & Sensory Feedback: How does the gear manage heat and provide sensory feedback to athletes with varying levels of sensation?
Inclusive testing, powered by generative design and parametric CAD, is the end of the one-size-fits-none era. It’s not a feel-good social initiative; it’s a profound market and engineering imperative. By designing for the edges of the human spectrum—from the elite para-athlete to the weekend warrior with a unique physiology—we don’t just make gear for a wider market. We make better gear for everyone. The “average” athlete is a ghost. The future of gear is designed for the individual, not the average.
Standards & Benchmarks (ISO/ASTM/SAE): The Grammar of Innovation
Standards can seem like a barrier to creativity. ISO, ASTM, SAE are just a few of the many regulatory bodies. They have lots of rules that might feel like they stifle innovation.
But what if we saw standards differently? Imagine them as a common language for engineers and designers worldwide. They help everyone understand what “safety” and “performance” mean. Meeting standards like ASTM F1446 for helmets is essential to enter the market.
The real challenge is not just meeting standards. It’s about understanding the why behind them.
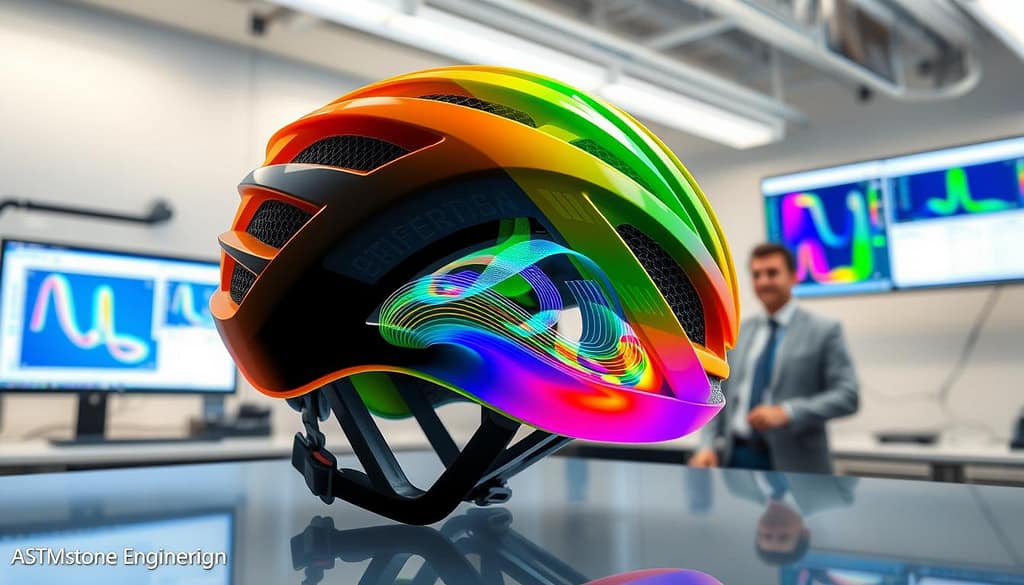
Our tools, FEA and CFD, are more than just validators. They help us design better without physical prototypes. FEA can predict how a helmet will perform in impacts. CFD can model airflow and thermal dynamics for new designs.
But, standards often lag behind technology. They reflect the best practices of the past. The ASTM test for football helmets might not cover today’s game. The ISO standard for running shoes might not account for new materials.
This is where innovation happens. Use FEA and CFD to go beyond the standard. Ask what happens when you push the limits of the standard.
The most innovative companies see standards as a starting point, not the end. They use simulations to explore new ideas. They create products that go beyond what the standard expects.
So, how do you navigate this world? The table below is a guide, not a rulebook. It helps you turn your ideas into certified products.
| Standard | Governing Body | Typical Scope | Role of FEA/CFD | Innovation Angle |
|---|---|---|---|---|
| ASTM F1446 | ASTM International | Impact protection for helmets (cycling, snow sports) | FEA simulates multi-impact scenarios; CFD models air ventilation for cooling. | Design for multi-impact absorption, not just single-impact pass/fail. |
| ISO 13232 | International Org. for Standardization | Motorcycle helmet safety and testing | CFD for aerodynamics; FEA for composite layer stress analysis. | Optimize for high-speed impact and rotational forces not in original tests. |
| SAE J211 | SAE International | Instrumentation for impact testing (crash dummies, sensors) | FEA validates sensor placement and predicts dummy biofidelity. | Develop next-gen sensors and dummy designs that better model human response. |
| ISO 9001 (Quality Systems) | International Org. for Standardization | Quality Management Systems | Ensures simulation and testing processes are repeatable and traceable. | Use FEA/CFD data to create a “digital twin” quality record for each product. |
The most innovative companies don’t just follow the rules. They create new ones. They use FEA and CFD to see beyond the current standards. The goal is to redefine what’s possible.
Injury Risk & Performance Trade-offs
In sports equipment design, every gain comes with a cost. We’re not just making gear; we’re balancing human limits with body safety. A 50-gram cut in a helmet could mean a gold medal or a concussion.
Think of a car analogy. A Formula 1 car and a family sedan both have top safety ratings. But the F1 car is built to push physics limits. It takes risks for that extra 2% performance, risks not seen in a minivan. In sports, we face the same choice: how much safety for performance, and vice versa?
The Risk-Reward Calculus
Cycling shoes are a good example. A stiffer sole boosts power but can harm the feet. We’re balancing watts with injury risk. Multibody dynamics helps us find the right balance through simulations.
It’s not just about avoiding big failures. It’s about managing small injuries that add up. A running shoe with lots of cushioning might reduce impact but adds weight and changes how you run. We’re designing a relationship between athlete and gear that evolves with use.
Quantifying the “Feel”
Athletes often talk about equipment in emotional terms. We need to turn “this shoe feels fast” into numbers. Surrogate models help us do this.
For tennis rackets, players want power and control. A stiffer frame gives more power but less control. We use multibody dynamics to find the perfect feel players describe.
| Performance Factor | Injury Risk Factor | Trade-off Consideration |
|---|---|---|
| Power Transfer Efficiency | Joint Stress | Stiffer materials transfer force better but increase joint loading |
| Weight Reduction | Impact Protection | Lighter gear improves speed but may compromise protection |
| Flexibility | Stability | More flex improves comfort but reduces energy return |
| Material Stiffness | Impact Absorption | Stiffer materials transfer more energy to the athlete |
Surrogate models help us explore this complex space. We can simulate how changes affect performance and safety without making prototypes. These models are our guide, showing us the limits of performance and safety.
Take helmets as an example. We can make them lighter but multibody dynamics shows more rotational forces during impacts. It’s a risk-reward choice that depends on the sport. A pro downhill biker might take the risk for a 200-gram weight saving, but a casual rider wouldn’t.
This isn’t just engineering; it’s sports psychology. That “confidence” athletes feel in great gear is the balance of performance and safety. Finding this balance is why we don’t just make gear; we build trust.
From Lab to Field: Longitudinal Data & Feedback Loops
The lab test is like a single photo. But the real world is a never-ending movie. This is the big challenge in testing sports gear. It’s where the digital twin must grow from a static 3D model to a living, breathing model.
We’ve talked about lab protocols, sensor stacks, and inclusive testing. But the big question is: Does the gear that does well in the lab test really help athletes perform better in real life? The lab gives us a perfect, controlled view. But the field is messy and unpredictable, yet beautiful.
This is where the digital twin idea really comes to life. It’s no longer just a static CAD model. We put the same sensors from our lab into the gear itself. So, that fancy midsole we designed? It has a pressure sensor. That new helmet material? It has a micro-IMU. Now, our digital twin is alive, sending us real-time data.
This is the feedback loop that closes the circle. The lab said our new midsole lattice should reduce tibial shock by 15%. But real-world data from a thousand runners over 500 miles tells us if it really works. Did that new fabric we simulated really keep athletes cool during a marathon? The sensors tell us the truth. This is how a digital twin grows from a blueprint to a living, learning model.
This long-term data is what turns a snapshot into a full movie. It answers the big question: Does our lab work match real-world performance over time? The feedback loop is simple: Design. Simulate. Prototype. Lab Test. Field Deploy with sensors. Collect data. Refine the digital twin. Repeat. This cycle makes a good product legendary.
To show how data moves from the lab to the field, consider this:
| Data Source | Lab Environment (The Snapshot) | Field Data (The Movie) | Correlation Metric |
|---|---|---|---|
| Impact Force | Measured on a drop tower with perfect form. | Measured over 500 miles of mixed terrain. | Shock attenuation over time, not just peak force. |
| Material Flex | 3-point bend test to failure. | Fatigue data from 10,000+ flex cycles in variable weather. | Predicted vs. actual material fatigue life. |
| Thermal Regulation | Controlled climate chamber test. | Core temp and humidity data from inside the garment during a race. | Predicted vs. actual moisture-wicking & breathability. |
So, does the correlation hold? The only way to know is to build the gear, embed the sensors, and test it in the wild. The data we get back is priceless—it’s the truth of real-world performance. It shows if our digital twin is real or just a ghost. If the correlation is strong, we’ve made something truly special.
The Toolkit: Building Your Validation Protocol
You’ve run the generative design. You now have a sleek, optimized part from your parametric CAD system. But the real work starts here. This is your validation protocol, connecting the digital world to the physical one. Here’s how to build your toolkit.
The Digital Backbone: PLM, PDM, and the Digital Thread
Your FEA and CFD results are more than reports. They are data points in a digital thread. This thread links your parametric CAD model to simulation and into a Product Lifecycle Management (PLM) system. It connects all simulations, from multibody dynamics to stress tests, creating a single truth.
This digital backbone ensures the virtual model used for FEA is the same for CFD analysis. It eliminates version chaos.
The Human Element: Athlete Panels and Expert Elicitation
Machines can’t feel. Your surrogate models and FEA outputs need human context. Athlete panels and expert elicitation provide this. Their feedback on a prototype’s comfort or stability adds subjective data that correlation algorithms need.
This feedback refines your digital models. It creates a loop where multibody dynamics simulations are grounded in biomechanical reality.
From SOPs to Schemas: Document or Die
Genius is not repeatable. Science is. Your protocol’s strength lies in its Standard Operating Procedures (SOPs). Every detail, from sensor placement to FEA boundary conditions, must be documented.
This turns a one-off test into repeatable, defensible science. These documented procedures ensure your correlation studies are consistent and auditable.
In the end, your generative design is just a hypothesis. This toolkit—the digital thread, human feedback, and rigorous SOPs—is the experiment that proves it. Build the protocol, and you build a better product.