
Let’s cut through the hype. Is a ‘digital twin’ just a fancy 3D model with a LinkedIn account?
In elite athletics, every millisecond and millimeter matters. We need the same level of detail as aerospace engineering. Think of Glaessgen and Stargel’s work on fighter jets.
A product-level digital twin for your equipment is more than a static CAD file. It’s a living, breathing multiphysics simulation that uses sensor data.
It’s based on Michael Grieves’ foundational taxonomy. It exists in three states: the Prototype, the Instance, and the Aggregate. This creates a continuous link between the physical and virtual worlds.
Confusing a true twin with a mere model is like mixing up a chess grandmaster with someone who just knows the pieces. One is static, the other is dynamic and learns.
This technology will change how we design and perfect sports gear. Let’s explore it further.
Building high-fidelity models: geometry, meshing, material cards
Creating a bike frame’s digital twin is a journey of precision and material knowledge. We move beyond simple sketches to create detailed digital models. These models are so accurate, they would impress a crime scene investigator.
This process isn’t just for marketing. It’s about capturing the essence of materials in digital form. We aim to create a digital twin that behaves just like the real thing under stress and strain.
Geometry is the first step. A carbon fiber bike frame is more than just a tube. It’s a complex sculpture shaped by wind tunnels and ergonomic studies. Every curve, junction, and thickness variation must be captured precisely.
Think of it like this: a photo shows an athlete’s form. But a detailed geometric model reveals their genetic makeup. It’s the difference between admiring a sculpture and having the blueprints and materials.
Meshing is where geometry meets math. We turn those curves into a network of tiny elements. This process is key for accurate simulations.
Why? Because each element can have specific material properties. This detail is essential for model validation. A single wrong element can lead to errors or incorrect results. The mesh must balance accuracy with computational efficiency.
Material cards are the magic behind it all. They define how materials behave in different directions. Aluminum is simple, but carbon fiber is complex, with strength varying by direction.
A material card in a multiphysics simulation is like a passport for elements. It tells the solver about the element’s properties. For example, it might say this element is steel with certain elastic properties.
Using real-world data for these properties is what makes a model realistic. It’s the step from shape to a model that truly understands physics.
| Modeling Aspect | Traditional Approach | High-Fidelity Digital Twin |
|---|---|---|
| Geometry | Simplified, idealized shapes for faster modeling | Forensic scan of actual geometry, including imperfections and wear |
| Meshing | Automated, coarse mesh often ignoring small features | Structured, filament-based or conformal mesh that respects all geometric details |
| Material Cards | Isotropic, linear material models from generic libraries | Anisotropic, nonlinear properties based on specific batch tests and layup schedules |
So, you’ve created a detailed digital model. But it’s just a body. To understand its performance, we need to see how it interacts with the world. This is where the real challenge begins.
Understanding how the model interacts with its environment is key. This is where model validation really starts. A bike frame in a vacuum is just art. But a bike frame under a rider, moving fast? That’s a story waiting to be told.
Athlete–equipment interaction and boundary conditions
Imagine a jet engine, but instead of a turbine, it has a human nervous system. This is what happens when an athlete uses equipment. It’s where your perfect FEA model meets the real, sweaty world.
In civil engineering, a boundary condition is like a fixed support on a bridge. It’s simple and clear. But athlete-equipment interaction is different. It’s like trying to model a smart, stubborn plasma.
A bicycle doesn’t just face wind drag; it’s the whole cyclist-bicycle system that does. Your CFD simulation needs to treat the rider as a living part, not a statue. The same goes for a golf club. The boundary isn’t just the grip; it’s the whole chain from shoulder to wrist, loading the shaft in a split second.
How do you simulate the difference between a 180-pound sprinter and a 120-pound climber on the same bike? One has raw power, the other steady force. The “boundary” isn’t a fixed point; it’s a changing load profile based on fatigue, adrenaline, and strategy.
Get this wrong, and your simulation is like a ship in a bottle, disconnected from real competition. The physics might be right, but the context is off.
This is why combining CFD and FEA is essential. The athlete’s body acts like a biomechanical actuator. The equipment responds to this with its structure and aerodynamics. You need FEA to see how the frame moves under the athlete’s load. And you need CFD to understand how the whole system moves through the air.
We use logic from more complex systems, like jet engines. The air interacts with the equipment, which is moved by the athlete. Defining this interaction is a huge challenge. It’s where physics meets flesh. And getting it right makes a simulation truly digital.
Coupling FEA, CFD, and MBD
In high-performance sports, isolating physics is like trying to listen to one instrument in a symphony. You miss the whole point. The real magic happens when physics work together.
Does the aerodynamic drag on a time-trial helmet change the neck load? Yes, it does. This is the core of multiphysics simulation. It’s where your digital twin becomes a whole system.
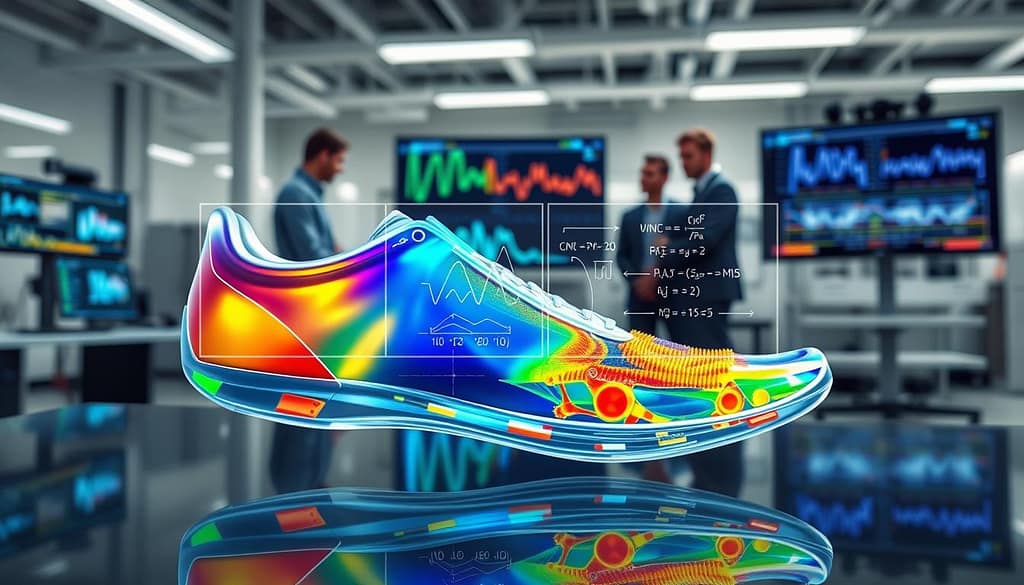
This integration is intense. We move from running CFD/FEA analyses alone to a coupled feedback loop. Think of a jet engine, where everything works together. Capturing this chaos is our goal.
The technical heart of this is bidirectional coupling. Data flows both ways. Forces from CFD change the shape in FEA, which then updates the fluid boundaries in CFD. This loop continues.
Engineers tackle this in two ways:
- System Models: Creating a master model that manages all physics solvers and passes data between them at each time step.
- Implicit Coupling: Using specialized software that solves equations for different domains at once, often more stable but intense.
The challenge is the nonlinearity. A small change in airflow can cause big changes in stress. The relationships are complex, with sudden thresholds and unexpected resonances. This is why integrated analysis is key for true performance prediction.
When done right, this coupling transforms a digital model. It stops answering “what if” in a vacuum and starts predicting “what will” in the messy real world. The multiphysics simulation becomes like having the actual bike, bat, or athlete in a lab. It’s the simulation equivalent of moving from checkers to three-dimensional chess—infinitely more complex, but the only way to play the real game.
Instrumentation and telemetry to feed the twin
Forget philosophy—a digital twin without live data is just a decoration. It looks nice but is far from real. This part is about making your virtual gear feel alive. We’re talking about telemetry, which connects your simulation to the real world’s sweat, vibrations, and impacts.
Let’s talk about the tools you need. Your setup is similar to what structural engineers use. Think of strain gauges on a bike frame, like those on the La Plata bridge. Or an Inertial Measurement Unit (IMU) on a bat handle, tracking every tiny movement in a swing. Even tiny pressure sensors in a shoe’s insole.
This isn’t science fiction. The IoT hype is real, shown in fields like construction. Engineers use thermocouples in concrete to check material strength, just like monitoring sports equipment wear. They use cheap, strong sensors like DS18B20s or ESP32 microcontrollers, logging data to an SD card.
But here’s the catch. The hardware is simple. The real challenge is in handling the data. You face a flood of raw, noisy field data. How do you clean, sync, and feed it into your simulation?
- Strain Gauges: Measure bending and stress. Is that frame flexing aerodynamically or is it about to snap?
- IMUs (Accelerometers & Gyros): Capture motion and orientation. What did the bat’s handle do in the 10 milliseconds before impact?
- Pressure Sensors: Map force distribution. Where is the athlete’s weight actually going in their cleats?
The journey from sensor to simulation is a three-act play:
1. Capture & Log: The sensor spits out voltages or digital readings at high frequency. This raw stream is often messy, with noise and dropouts.
2. Clean & Synchronize: This is the unglamorous hero work. Filter out electrical noise. Time-sync data from different sensors (did the strain spike before or after the IMU registered impact?). Convert voltages into meaningful engineering units (Newtons, G-forces, degrees).
3. Format & Ingest: Structure this clean data into a format your simulation software craves—often a CSV file or a direct API feed. This final, tidy dataset is what truly “feeds the twin.”
Choosing the right sensor is half the battle. Here’s a quick breakdown of the frontline troops in your telemetry army:
| Sensor Type | What It Measures | Sports Equipment Use Case | Key Data Challenge |
|---|---|---|---|
| Strain Gauge | Local deformation (strain) | Bike frame, golf club shaft, ski | Temperature compensation; signal noise |
| IMU (Accel/Gyro) | Linear acceleration, angular velocity | Bat, racket, helmet | Sensor fusion; drift correction |
| Force/Pressure Pad | Distributed load | Footwear, saddle, grip | Calibration; hysteresis effects |
| Potentiometer | Angular or linear position | Suspension travel, joint angle | Wear and mechanical slack |
Your digital twin is only as good as its last meal of real-world bytes. Instrumentation provides the nourishment. Without it, you’re just doing guesswork. With it, you create a living model that evolves, a concept key for validating simulation predictions. Once this data is flowing, the next logical step is using it to refine the model itself—which brings us to the art of model updating.
Model updating and parameter identification
You’ve built a simulation masterpiece, but does it match reality? That’s where model updating comes in. It’s when your digital twin starts proving its worth.
Your FEA says the bat flexes 5mm, but the camera shows 7mm. Who’s right? Usually, it’s your model’s assumptions. This gap is the start of finding the truth.
Think of it as solving a mystery with field data clues. You’re figuring out the real story from the data.
Engineers calibrate a bridge’s concrete modulus from real-world strain data. They don’t guess. They match the model to the real data. That’s how it works.
In sports gear, it’s the same. We use telemetry to question our digital clone. “Why is your drag coefficient off?” “Why does the sweet spot feel wrong?” The answers are in the parameters.
The process isn’t magic. It’s a careful, often repeated loop:
- Run the simulation with your best-guess material properties and boundary conditions.
- Compare outputs (stress, displacement, acceleration) against recorded field data.
- Identify the gap. Is it the composite’s stiffness? The damping factor? The friction coefficient?
- Tune the parameters and run it again. Repeat until the simulation’s behavior aligns with reality.
The goal is to turn an educated guess into a precise prediction tool. This whole process relies on high-quality field data. This starts with smart instrumentation and data acquisition hardware.
This is the core of model validation. It’s what makes a static CAD model into a dynamic digital twin. You’re not just building a model. You’re teaching it to see the world as it is.
Verification, validation, and uncertainty quantification
Before you bet on a simulation, make sure it’s true. This is about trusting your digital twin. It’s not just about following rules. It’s about making a solid choice.
We use a special trio from aerospace and engineering: Verification, Validation, and Uncertainty Quantification (V&V&UQ). They are like three locks that make your prediction reliable.
- Verification: Did I solve the equations right? This checks the math in your CFD/FEA solver. No coding bugs allowed.
- Validation: Did I solve the *right* equations? This is where your simulation meets reality. Does the virtual bike drag match the wind tunnel data? This is the heart of model validation.
- Uncertainty Quantification (UQ): How wrong might I be? It measures doubt. Is that predicted 3% drag reduction real, or is it a numerical mirage within the error bars?
In sports, the stakes are high. Recommending a new bike frame or bat swing without checking is risky. UQ gives you a confidence level for your prediction. It shows the chances.
This isn’t a one-time check. As shown in research on the inherently probabilistic nature of digital twins, validation is ongoing. Your twin learns and adapts, and so must your trust in it. The “model matching” use case is, at its core, a live model validation exercise.
So, we test virtual equipment as hard as we test real things. We ask tough questions our athletes would. Because a beautiful simulation without verified, validated, and quantified uncertainty is just a very expensive story.
Use cases: drag on bikes, swing dynamics in bats, ball flight
Theory is for the lab. Performance is for the podium. Here’s how coupled CFD/FEA simulations turn data into gold.
Let’s look at three scenarios where a digital twin sports equipment system is a game-changer. We’re talking about real gains: shaving seconds off a lap, finding the perfect spot on a bat, and predicting a ball’s path with accuracy.
Each case is a masterclass in multiphysics coupling. Fluid dynamics and structural mechanics have a chat, with rigid-body motion listening in. Real-world sensor data keeps the conversation honest.
Imagine a cyclist as a complex, moving sculpture disrupting airflow. The goal is simple: minimize drag. The execution is not.
A high-fidelity digital twin here couples Computational Fluid Dynamics (CFD) with Multibody Dynamics (MBD). The CFD model simulates airflow over the rider-frame system. The MBD model simulates the athlete’s pedaling motion and body position changes.
Where’s the magic? The boundary condition is live power meter data. This real input drives the simulation, showing how a tiny tuck of the elbows or a shift in saddle position changes pressure fields and vortex shedding. The output isn’t just a pretty flow visualization. It’s a precise map of where watts are being wasted.
Validation comes from wind tunnel tests and on-bike telemetry. The twin becomes a virtual wind tunnel that’s always on, even during a race.
The Batter’s Quest for the Perfect Crack
A baseball bat hitting a ball isn’t a simple rigid collision. It’s a symphony of flex, vibration, and energy transfer. Capturing that requires a different kind of coupling.
This twin combines Finite Element Analysis (FEA) for the bat’s flexibility, MBD for the full swing kinematics, and sometimes even acoustics to model that satisfying ‘crack’ of perfect contact. High-speed video provides the swing path truth. Handle sensors measure grip forces and vibration.
The FEA model reveals how the bat bends and vibrates upon impact. Does it whip? Does it stutter? The twin identifies the exact swing parameters that maximize energy transfer to the ball while minimizing sting in the hands. It finds the sweet spot’s sweet spot.
The Ball’s Defiant Dance with Physics
A ball in flight is a rebel. Spin, seams, and atmospheric conditions conspire to defy simple parabolic arcs. Predicting its path demands respect for these forces.
For this digital twin, CFD models the aerodynamics—the Magnus effect from spin, the turbulent wake from seams. This is tightly coupled with a rigid-body dynamics solver for the core trajectory.
The calibration data is world-class: Hawk-Eye vision systems or TrackMan radar. These systems feed the twin with real spin rates, launch angles, and velocities. The model updates to match reality, learning how a specific pitcher’s fastball or a golfer’s draw actually behaves.
The result? A predictive tool that can forecast landing spots with stunning precision, useful for everything from training to broadcast graphics.
| Use Case | Physics Coupled | Data Feed | Key Output | Real-World Validator |
|---|---|---|---|---|
| Bike Aerodynamics | CFD + Multibody Dynamics | On-bike power meter, body position sensors | Drag coefficient (CdA) map relative to rider posture | Wind tunnel measurements, lap time splits |
| Bat Swing Dynamics | FEA + Multibody Dynamics + Acoustics | Handle force sensors, high-speed video, impact sound | Energy transfer efficiency, vibration damping profile | High-speed video impact analysis, player feedback |
| Ball Flight Trajectory | CFD + Rigid-Body Dynamics | TrackMan/Hawk-Eye radar, launch monitors | Predicted landing coordinate with spin/weather effects | Actual ball landing position from tracking systems |
| Common Insight | Multiphysics Simulation | Live Sensor Telemetry | Actionable Performance Metric | Empirical Measurement |
So, what’s the common thread? It’s the closed loop. Each use case starts with a sophisticated, coupled simulation. It’s then fed a diet of real-world data. The model adjusts, learns, and spits out an insight you can actually use to change an outcome. That’s the move from digital novelty to performance essential.
Toolchain integration and data schemas
Building a digital twin is like making a movie. The toolchain is the messy part that doesn’t always work as planned. We dream of seamless automation, but reality is often a mix of different software that doesn’t always get along.
Imagine having CAD, FEA, CFD, and a data lake all working together. It sounds good, but it’s hard to make it happen. You need something to connect them all, like plumbing.
This part of building a digital twin is not glamorous. It’s the backbone of multiphysics simulation. A real-world toolchain might look like this: Sensors -> Arduino/ESP32 -> CSV files -> Grasshopper/Python for processing -> Karamba3D/CONS for simulation. It works, but it’s fragile.
Why does this matter? Without strong integration, your digital twin is just a pretty picture. It can’t learn or update. The magic happens when data flows freely from the field back into the model.
This requires rules of conversation. We call them data schemas and APIs. Think of a schema as a contract. It says what a sensor reading looks like and how we define material properties. An API is the polite handshake that lets one tool ask another for data.
Other industries have figured this out. Construction, for example, has BIM (Building Information Modeling) and the IFC standard. IFC is an open, structured data schema for geometry and properties. It lets different tools talk to each other.
Sports equipment needs its own version of IFC. We need schemas for athlete biomechanics, composite layups, and aerodynamic coefficients. Open standards beat proprietary black boxes every time. They future-proof your investment and let you swap out tools without starting over.
So, how do you evaluate your data exchange methods? The table below breaks down the common options. It’s a reality check.
| Exchange Method | Ease of Integration | Data Fidelity | Tool Flexibility | Maintenance Overhead |
|---|---|---|---|---|
| CSV/Text Files | High (Simple) | Low (Prone to errors, no context) | High (Any tool can read) | High (Manual scripting, breaks often) |
| Proprietary API | Medium (Vendor-specific) | High (Structured, validated) | Low (Lock-in to one vendor) | Medium (Updates controlled by vendor) |
| Open Standard (e.g., IFC, FMI) | Low (Initial setup complex) | Very High (Rich, semantic data) | Very High (Interoperable) | Low (Community-supported, stable) |
| Direct Database Link | Medium (Requires DB skills) | High (Live, consistent data) | Medium (Depends on DB schema) | Medium (IT infrastructure needed) |
The goal is to move from the left column to the right. Start with CSV to prove the concept. But plan for an open standard. Your toolchain shouldn’t be a secret recipe only you understand. It should be a documented, repeatable process.
This is where the real engineering happens. It’s not just about solving equations. It’s about building pipelines that are resilient. A broken data flow stops the entire multiphysics simulation engine. The best physics model is useless without fresh, clean fuel.
Ask yourself: Can my toolchain run automatically overnight? If the answer is no, you have integration debt. It’s technical debt’s uglier cousin. It silently drains time and introduces errors.
The promise is a self-updating digital twin. The path is paved with solid data schemas. Think of your digital twin as the conductor. Each software tool is an instrument. The schema is the sheet music. Without it, you get noise. With it, you get a performance. And in the high-stakes game of sports equipment, we’re all aiming for a standing ovation.
ROI, compute costs, and team skills
If you think digital twins are just fancy simulations, wait until you see the bill for compute hours—and the even bigger check they help you avoid. Let’s talk brass tacks. Is building a digital twin for sports equipment worth the investment? The answer isn’t in a spreadsheet. It’s on the podium.
Do the back-of-the-envelope math. Fabricating and wind-tunnel testing fifty prototype bike frames? That’s a six-figure vacation for your budget. Running a thousand computational hours on a cloud cluster? That’s a hefty dinner bill. The ROI isn’t merely about direct cost savings. It’s about accelerated innovation cycles and dramatic risk reduction. You fail fast in the digital realm, not on the factory floor.
But those compute costs are real. High-fidelity multiphysics models are computational divas. They demand supercomputer resources and time you might not have. This is the core trade-off: exquisite detail versus real-time speed.
The smart play is model order reduction. Think of it as turning a symphonic score into a killer guitar riff. It captures the essential physics without the bloat. You transform a supercomputer problem into a laptop-friendly one. This is how you make a digital twin sports equipment platform viable for daily use by coaches and engineers.
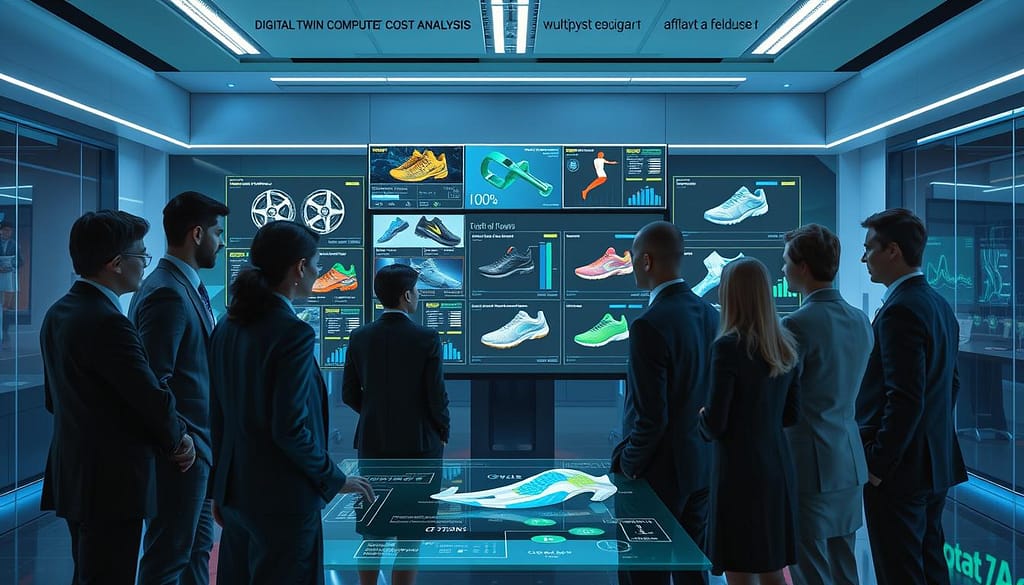
Now, for the human element. You can’t run this operation with a team of specialists who only speak one language. You need a modern, multidisciplinary pit crew.
This rare breed discusses Poisson’s ratio over breakfast, debugs Python scripts by lunch, and analyzes athlete biomechanics by dinner. They are the alchemists who blend domain expertise with data science.
Let’s break down the cost-benefit shift. The table below contrasts the old-school prototype-and-test grind with the digital twin approach.
| Aspect | Traditional Physical Testing | Digital Twin Approach | Key Impact |
|---|---|---|---|
| Primary Cost Driver | Material fabrication, facility rental (e.g., wind tunnel) | Cloud compute hours, software licenses, skilled labor | Shift from capital-intensive to operational & intellectual |
| Iteration Speed | Weeks to months per design cycle | Hours to days per simulation cycle | Innovation velocity increases by an order of magnitude |
| Risk Mitigation | Physical failure reveals flaws late and expensively | Virtual failure predicts issues early and cheaply | Major reduction in costly dead-end prototypes |
| Required Team Skills | Mechanical engineers, machinists, test technicians | Computational physicists, data scientists, DevOps engineers, sports scientists | Broader, blended skill set focused on modeling and data |
| Scalability | Linear cost increase with each new test | Marginal cost decrease as models are reused and refined | Long-term efficiency and knowledge compounding |
The initial setup for a digital twin sports equipment ecosystem isn’t cheap. You’re paying for top-tier talent and computational muscle. But the payoff is a virtuous cycle. Each simulation adds to a living knowledge base. This asset appreciates over time.
So, what’s the final tally? The real return on investment isn’t just dollars saved next quarter. It’s the uncertainty removed from every future design decision. It’s the ability to ask “what if” a thousand times before cutting metal. That’s the power of a true digital twin for sports equipment. It turns guesswork into strategy.
Maturity roadmap and governance
Think of your digital twin deployment like a tech startup. You don’t scale to a unicorn overnight. Your first milestone is the Digital Twin Prototype—the golden master model for your product line. It’s your blueprint.
From there, you spawn Digital Twin Instances for individual athletes or specific gear. These instances live, breathe, and learn from their own telemetry. The final frontier is the Digital Twin Aggregate, a federation of twins for an entire team. This reveals macro patterns you’d miss.
This roadmap is useless without governance. Who owns the data? Who has permission to update the core physics model? Version control isn’t just for software engineers. Rigorous model validation is the repeated audit that keeps your twin honest. It separates a useful predictive tool from a fancy animation.
Governance starts with the data feeding the twin. Clean, compliant signal acquisition is non-negotiable. This means adhering to standards for accuracy, latency, and durability from day one. Solid sensor data governance is the bedrock. It ensures your field data is trustworthy enough for serious model validation.
The boring stuff—documentation, update protocols, access controls—is what transforms a one-off science project into a sustained competitive edge. It’s the less-sexy, critical work that actually builds Rome.