
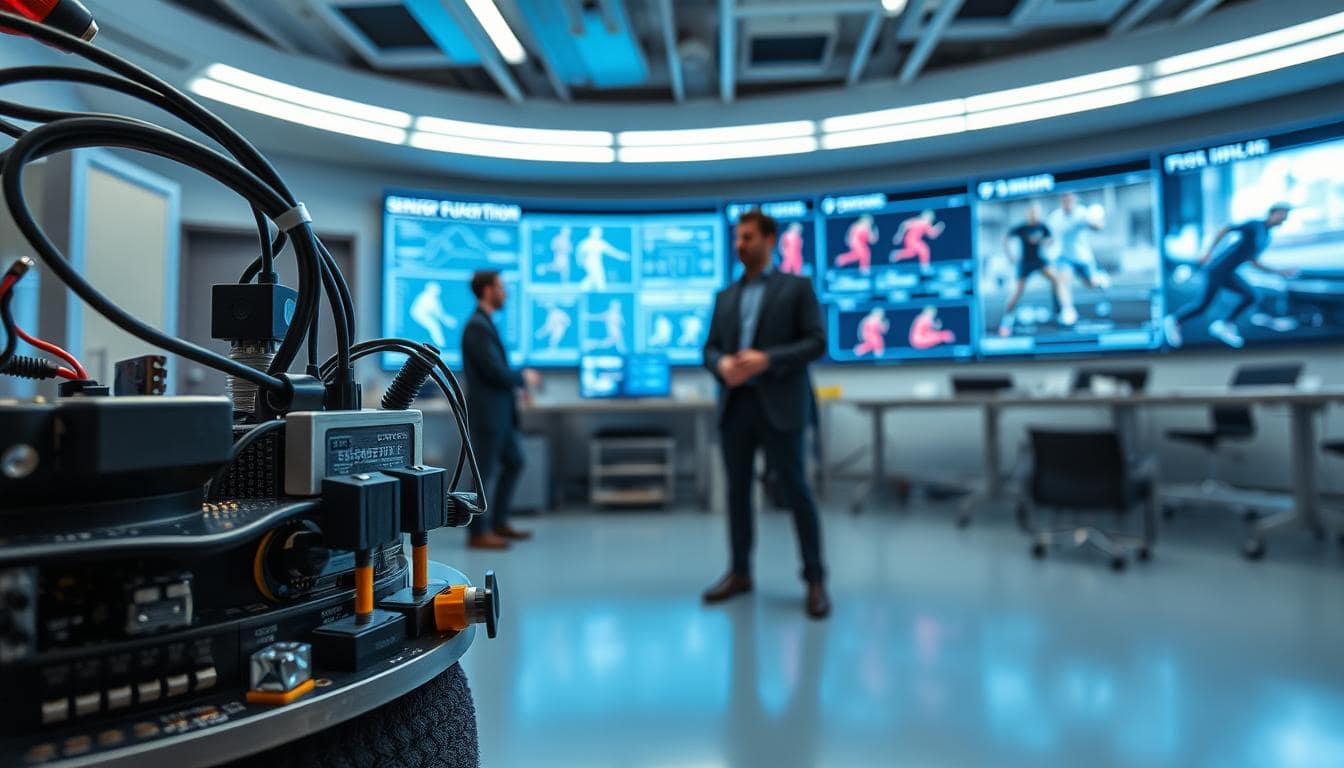
Ever wonder why your fitness tracker can count steps but can’t capture the precise motion of a professional athlete? The difference lies in the hardware foundation. It’s like the difference between a Swiss Army knife and a proper mechanic’s toolkit.
The Bimu R2’s recent redesign is a tech enthusiast’s dream. They replaced the microcontroller with an STM32U031, boosting power efficiency. They also added a 0.3mm steel stiffener to reduce thermal drift by 5°C.
They simplified the power architecture with a unified I/O connector. This shows they understand minimalism. These upgrades aren’t just about specs. They allow you to capture tibial acceleration at 4000Hz without overheating.
This level of IMU sensor fusion makes a big difference. It separates recreational tracking from professional sports analytics. The hardware choices matter more than most realize.
IMU specs, ranges, placement
Ever wonder why some motion tracking feels shaky while others are smooth? It’s all about specs, ranges, and placement. Get these wrong, and your tracking is like filming with a flip phone.
The LSM6DSL sensor is like a precision instrument. It captures movements at 6664Hz, fast enough to make Usain Bolt dizzy. This speed is key to seeing the biomechanics of movements clearly.
The accelerometer and gyroscope work together like Fred Astaire and Ginger Rogers. The accelerometer tracks linear movement, while the gyroscope handles rotation. Together, they provide detailed data on how the body moves.
Standard deviation patterns across axes are important. The X-axis shows more noise during fast movements, while the Z-axis stays stable. This helps algorithms filter out noise.
Using six IMUs is not random. It’s like a strategic deployment:
- Forearms: Capture arm swing dynamics and subtle gestures
- Lower legs: Track stride length, cadence, and ground contact
- Head: Monitor gaze stabilization and impact forces
- Pelvis: The command center for overall body orientation
Each placement has a specific purpose. The pelvis IMU is like the conductor, while others are specialized musicians. Misplace one, and your motion capture sounds off.
The table below shows why specs matter. These aren’t just numbers – they’re the difference between good data and bad:
| Parameter | Standard Range | LSM6DSL Performance | Real-World Impact |
|---|---|---|---|
| Sampling Rate | 100-400Hz | Up to 6664Hz | Captures micro-movements invisible to standard sensors |
| Accelerometer Range | ±2g to ±16g | ±2g to ±16g programmable | Prevents saturation during explosive movements |
| Gyroscope Range | ±125dps to ±2000dps | ±125dps to ±2000dps programmable | Handles everything from subtle rotations to violent spins |
| Noise Density | 100-200 μg/√Hz | 75 μg/√Hz (accel) | Cleaner data means less filtering, more truth |
Choosing the right ranges is not about maxing out settings. It’s about matching capabilities to movement profiles. A ballet dancer needs different settings than a football linebacker. The LSM6DSL’s programmable ranges let you tailor sensitivity like a master sommelier pairing wine with food.
Placement precision is key. A forearm sensor placed two centimeters too high might miss wrist flexion data. Pelvis placement offset by an inch could throw off body orientation calculations. This isn’t jewelry – it’s biomechanical instrumentation.
The magic happens when specs, ranges, and placement work together. Get all three right, and you’re not just tracking movement – you’re capturing the hidden language of human motion. Get them wrong, and well… let’s just say you’ll have great data about how someone moves incorrectly.
Fusion Algorithms
If turning raw motion data into usable insights were dating, we’d have some fascinating relationship dynamics to analyze. Each algorithm brings its own personality to the party.
Complementary filters are that comfortable, long-term partner who keeps things stable and predictable. They’re the relationship you can count on when things get shaky.
Then there are the Kalman filters – the exciting but high-maintenance new flame. Extended and Unscented varieties bring mathematical complexity that promises accuracy but demands constant attention.
Madgwick’s algorithm plays the mediator, trying to get everyone working together smoothly. It’s the diplomatic approach to orientation estimation.
The choice isn’t about finding the “best” algorithm. It’s about which trade-offs you’re willing to make when reality inevitably diverges from textbook perfection.
Each method interprets the chaotic dance of accelerometer and gyroscope data differently. Some prioritize stability, others chase accuracy, and a few just want everyone to get along.
Complementary vs EKF/UKF vs Madgwick—trade‑offs
Choosing the right sensor fusion algorithm is like picking a dating app strategy. You might choose simplicity, complexity, or hope for a middle ground. Each choice has its own trade-offs.
The complementary filter is like a reliable friend who’s always on time but never brings flowers. It’s great for systems with limited resources because it’s low on computational cost. It’s stable under normal conditions but struggles with wild motion.
The Kalman filter family, including the Extended Kalman Filter (EKF) and Unscented Kalman Filter (UKF), are like overachievers. They offer high accuracy by modeling system dynamics and noise. But, they require a lot of processing power and are complex to implement.
The Madgwick filter aims for balance. It uses gradient descent optimization for efficiency and decent accuracy. But, its performance can vary based on how it’s implemented and the motion conditions.
So, when does each algorithm shine? Complementary filters are best for basic orientation tracking where resources are limited. The Kalman filter variants are great for high-precision tasks where resources aren’t a problem. Madgwick is ideal for consumer devices needing good accuracy without using too much power.
| Algorithm | Computational Cost | Accuracy | Implementation Complexity | Best Use Case |
|---|---|---|---|---|
| Complementary | Low | Moderate | Simple | Basic orientation tracking |
| EKF/UKF | High | Excellent | Complex | High-precision navigation |
| Madgwick | Medium | Good | Moderate | Consumer electronics |
Choosing the wrong fusion method is like using Shakespearean English to order fast food. It’s technically possible but very inefficient. The Kalman filter might be too much for a fitness tracker, while complementary filtering fails in aerospace.
Motion conditions greatly affect performance. Slow, predictable movements? Complementary filters are fine. But rapid, chaotic motion? That’s when Kalman filter variants shine. Madgwick tries to adapt to both, sometimes succeeding, sometimes failing.
Implementation complexity also varies. Complementary filters are easy to code during a coffee break. EKF/UKF implementations are much harder, requiring advanced math and therapy. Madgwick is in the middle, challenging but achievable for most developers.
In the end, the choice depends on your specific needs. Are you making a toy or a surgical robot? Does your device have the power of a supercomputer or a potato? Be honest, and the right algorithm will choose you.
Calibration Pipeline
Ever tried playing a perfectly tuned grand piano that hasn’t been calibrated? It doesn’t matter how brilliant the musician – everything sounds slightly off. The same principle applies to motion tracking technology.
Calibration isn’t just a checklist item. It’s a sacred ritual that turns guesswork into real data. It’s like the backstage crew that makes performers look flawless.
We’re talking about finding your device’s “quiet place” through static calibration. Then understanding that movement isn’t perfect with dynamic calibration. And let’s not forget magnetometer calibration – because apparently your laptop and the building’s steel framework are actively conspiring to distort your magnetic field.
This unsexy foundation is what makes the sexy motion capture possible in IMU sensor fusion sports applications. It’s the digital equivalent of tuning that grand piano before the concert begins.
Static/dynamic, mag hard/soft‑iron
Welcome to the world of calibration, where precision meets movement. Static methods aim for perfect stability, while dynamic methods embrace the real world’s chaos. It’s like comparing a posed photo to candid shots at a party.
Static calibration assumes you can hold your device perfectly. But, let’s face it, humans are not always steady. This method averages sensor readings while stationary. It’s simple but requires a lot of patience.
Dynamic calibration, on the other hand, accepts that we move. It collects data during actual motion, making calibration more realistic. It’s like learning to dance versus memorizing dance steps.
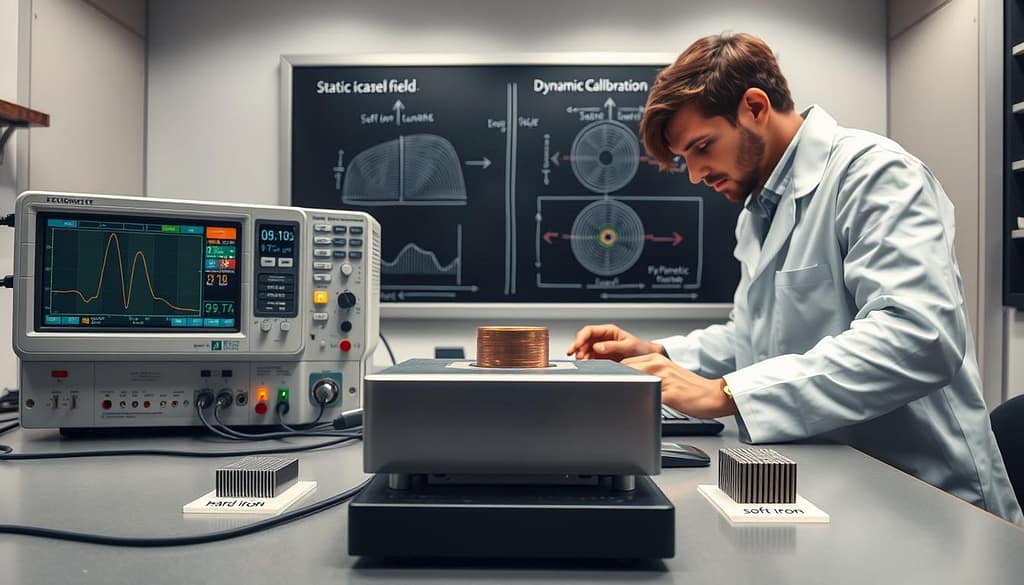
The magnetometer is a key sensor that measures Earth’s magnetic field. But, it’s easily affected by nearby magnets. Hard-iron and soft-iron effects are like the magnetometer’s good and bad days.
Hard-iron effects are permanent magnetic distortions. They’re like a phone case magnet ruining your compass. These can be fixed with the right calibration.
Soft-iron effects are temporary magnetic disturbances. They’re like the magnetic field’s mood swings. Your office chair or desk lamp can cause these.
The calibration process includes:
- Stationary bias determination through multi-position averaging
- Scale factor calibration using known motion patterns
- Magnetic distortion compensation through ellipsoid fitting
- Environmental factor assessment for real-world accuracy
Why does this matter? Without proper magnetometer calibration, your device’s heading estimates will be off. The Earth’s magnetic field is weak, about 100 times weaker than a fridge magnet.
Proper calibration turns your data into useful insights. It’s the difference between a compass that points north and one that doesn’t.
The best strategy? Mix static and dynamic methods. Use static for initial bias removal and dynamic for real-world adjustments. For the magnetometer, use detailed calibration routines for both hard-iron and soft-iron effects.
Remember, your sensors don’t live in a perfect lab. They’re in the real world, facing magnetic interference and movement. Your calibration should reflect this.
Drift Management
Ever watched a teenager with attention deficit disorder try to focus? That’s your IMU sensor trying to keep its bearings. It starts strong but then drifts off into its own world.
This isn’t about being perfect. It’s about handling the inevitable. Like any long-term relationship, small changes add up. Soon, you’re far from where you began.
We track this drift through Allan deviation analysis and bias instability tracking. The data shows patterns of error that would make a statistician cry.
The real magic is in sensor fusion for sports. It’s like couples therapy for your data. It uses constraints, ZUPT techniques, and event resets to align reality and measurement.
Good drift management turns errors into something to learn from. Your sports tracking stays precise when it counts the most.
Constraints, ZUPT, event resets
Sensor drift is like a slow creep of error. Constraints and resets are like reality checks that keep our systems honest. They’re like the algorithm’s occasional glance at a map during a road trip – because sometimes GPS alone isn’t enough.
ZUPT (Zero-Velocity Updates) represents those precious moments of certainty. When a foot plants firmly on the ground during gait analysis, we get a brief window where velocity should read exactly zero. It’s like catching your breath during a marathon – a momentary pause that recalibrates your entire system.
Kinematic constraints are the rules of human movement that algorithms somehow keep forgetting. Knees don’t bend backward, elbows have limited range, and hips aren’t ball joints with 360-degree rotation. Implementing these biological realities into our models provides natural drift correction that feels less like math and more like common sense.
Event-based resets are the dramatic interventions our systems occasionally need. When the algorithm recognizes it’s gone too far down the wrong path, it admits mistake and restarts. It’s the difference between stubbornly continuing down the wrong highway exit and actually pulling over to check directions.
These three techniques work together like a smart navigation system:
- ZUPT provides momentary truth anchors
- Constraints keep movement within biological possibility
- Event resets prevent catastrophic drift accumulation
The beauty of this approach to drift correction is how it mirrors human problem-solving. We don’t just plow forward when we’re lost – we pause, check our constraints, and sometimes reset entirely. Our algorithms are now learning to do the same.
Event reset protocols fascinate me. They require the system to develop enough self-awareness to recognize when it’s wrong – something humans struggle with daily. The implementation involves threshold triggers that tell the algorithm: “You’ve drifted too far, time to admit it and start fresh.”
This combination of techniques creates a robust drift correction system that’s both mathematically sound and biologically informed. It’s not about eliminating error entirely, but about building in enough reality checks to keep the system trustworthy where it matters most.
Feature Extraction
Welcome to the digital art gallery of athletic performance. Here, raw sensor data turns into meaningful insights. It’s the moment when chaos becomes clarity.
Imagine turning random splatters of paint into a masterpiece. We’re talking about finding swing phases with the precision of a film editor. And calculating joint angles that would impress Euclid.
This process is where engineering meets biomechanics. It’s the magic that turns electrical signals into coaching gold. Suddenly, “sensor moved a lot” becomes “athlete performed a perfect stride with 27-degree knee flexion.”
The real power comes through advanced fusion techniques. These combine multiple data streams. This creates a detailed picture of athletic movement that’s more than its parts.
We’re not just measuring movement. We’re interpreting performance. We turn numbers into stories that coaches and athletes can use to get better.
Swing/stride segmentation, joint angles
Human movement is like a dance, with each step telling a story. The swing phase is all about getting ready for landing. The stance phase is when power is transferred.
This way of looking at movement shows the beauty of dance and sports. It highlights how dancers and runners move with grace and power. The data goes beyond just counting steps.
Quaternions are the heroes of 3D rotation. These four-dimensional numbers solve the problem of gimbal lock. They handle complex rotations that others can’t.
With quaternions, calculating joint angles becomes simple. We can describe movements precisely, without using vague terms. This is key for studying sports or diagnosing movement issues.
| Approach | Rotation Representation | Gimbal Lock Risk |
|---|---|---|
| Euler Angles | Three separate rotations | High |
| Rotation Matrices | 9-number matrix | None |
| Quaternions | 4-number complex system | None |
The table shows why quaternions are best for tracking rotations. They keep their math stable, unlike others. This makes them great for studying athletic movements.
Quaternions help us understand everything from golf swings to how people recover from injuries. They turn raw data into useful insights into how our bodies move.
Benchmarking
Welcome to the moment of truth in IMU sensor fusion sports technology. This is where your carefully crafted algorithm either becomes the next big thing or gets exposed like a bad karaoke performance.
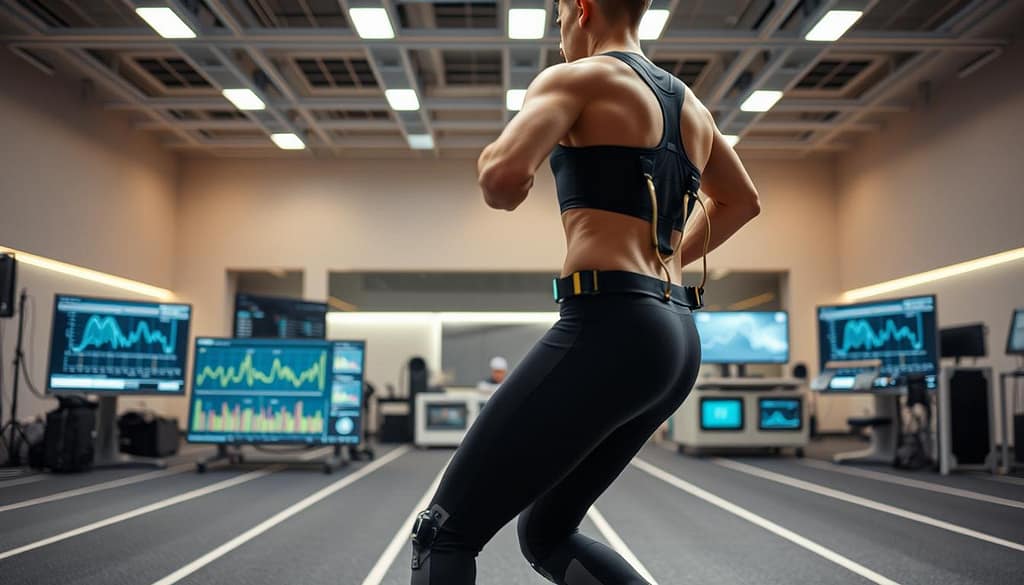
We’re comparing inexpensive motion trackers to six-figure optical systems. These are the gold standards that cost more than most cars. It’s the scientific version of “prove it.”
Performance evaluation methodologies separate actual results from marketing claims. We use metrics like RMS error and correlation coefficients. These help us see if our approach captures reality or just creates a convincing simulation.
Validation against ground truth systems tells us whether we’re measuring athletic performance or just generating pretty data visualizations. The numbers don’t lie – even when we wish they would.
Optical MoCap comparisons, protocols
Comparing IMU systems to optical motion capture is like comparing a Broadway show to its Hollywood version. Both tell the same story but in different ways. Optical systems are our top standard, showing how precise IMU systems can be.
Why do these comparisons matter? They help us know if IMU systems are worth the investment. Validation studies bridge the gap between research and real-world use.
Standardized testing protocols help us compare fairly. Researchers use specific movements to test both systems:
- Slow, controlled motions to test baseline accuracy
- Rapid direction changes to evaluate latency
- Complex multi-joint movements for coordination analysis
- Environmental challenges that mimic real-world conditions
The data shows where IMU technology stands. Here’s how it compares in lab tests:
| Performance Metric | Optical MoCap | IMU Systems | Practical Significance |
|---|---|---|---|
| Position Accuracy | Sub-millimeter | 1-2 centimeter | Clinical vs functional assessment |
| Sampling Rate | 100-500 Hz | 50-200 Hz | Capturing rapid micro-movements |
| Setup Time | 30-60 minutes | 2-5 minutes | Laboratory vs field deployment |
| Cost per capture | $500-2000 | $20-100 | Research budget vs clinical practicality |
These comparisons show the trade-off between precision and practicality. Optical systems are super accurate but hard to use outside labs. IMU technology makes motion capture portable, reaching people everywhere.
Researchers use these protocols to improve IMU technology. Each study finds areas for improvement, driving innovation in sensors and calibration.
Standardizing protocols is the scientific community’s effort to organize motion capture validation. It ensures accuracy claims are consistent across studies.
This isn’t just about comparing numbers. It’s about whether wearable tech can replace lab equipment for biomechanical analysis. The answer is getting closer to “yes” with each study.
Edge vs Cloud
Imagine a martial artist versus a supercomputer. The martial artist acts fast, right here, right now. The supercomputer, on the other hand, calculates endless possibilities from afar. This is the edge versus cloud debate.
This isn’t just about where things happen. It’s a battle between quick action and endless power. The edge is like a self-contained ninja, fast but limited. It can’t do much on its own.
The cloud is like an all-knowing oracle. It has massive power and endless possibilities. But, it needs a stable internet connection. Without it, your device is just a regular one.
This choice affects everything. Will your IMU sensor fusion sports app give real-time feedback or just historical data? Can it run all day on one charge, or does it need a power outlet every hour?
The answer isn’t just the cloud or the edge. It’s about knowing which one fits your needs. Sometimes, you need the quick action of a martial artist. Other times, you need the vast power of a supercomputer. Smart architects choose wisely.
Latency, bandwidth, battery
Designing wearable tech is like facing a three-headed dragon. Even with the best algorithms, you need to conquer latency, bandwidth, and battery issues. Without these, your tech is just an expensive paperweight.
Latency affects how fast your system responds. A small delay can mean the difference between real-time feedback and delayed analysis. It’s like the difference between coaching a golf swing and analyzing it after the game.
Bandwidth is like shipping options for digital data. You can send raw data or processed features. This choice affects cloud costs and network reliability.
Battery life is a harsh reality check. Our Bimu R2 has a 220mAh battery that lasts 2 hours 49 minutes at 4000Hz sampling. It’s not just a spec; it’s what makes it ready for the field.
Here are some key thresholds:
- Real-time feedback needs under 50ms latency
- Streaming raw data requires 2-4Mbps bandwidth
- Processed features cut bandwidth needs by 90%
- 4000Hz sampling uses 78mA current continuously
The power consumption shows a harsh truth. The 2h49min runtime at max sampling is not a suggestion. It’s a hard limit that separates dreams from reality.
You’re not just designing a system. You’re balancing physics, math, and lithium-ion chemistry. Get it wrong, and your wearable becomes a charger-dependent letdown.
Smart developers make smart trade-offs. They process data on-edge to save bandwidth. They use sleep modes and choose transmission frequency wisely.
In the end, the best motion tracking system is useless if it fails during the game.
Developer Deliverables
Ever wonder why great ideas turn into real-world problems? This is where the magic ends and the hard work begins. It’s where ideas become practical tools.
Our SDK isn’t just code. It’s a detailed system that makes integration easy or hard. Think of it like building with LEGOs or solving a Rubik’s Cube blindfolded.
API design is key. It decides if developers feel like heroes or if they’re stuck with broken tools. We aim to empower, not frustrate.
Testing is what separates good systems from bad ones. Unpredictable tools can kill innovation. They work… sometimes.
This is where theory meets reality. The hard work that turns brilliant ideas into something useful. It’s the unglamorous part that matters.
SDK structure, APIs, test plans
Building motion tracking technology is like composing a symphony. Every part must work together perfectly. The SDK structure is like the conductor, making sure everything fits together smoothly.
Our APIs are like a universal language for motion data. They take raw sensor readings and turn them into useful insights. It’s like a bridge between your code and our motion intelligence.
Test plans are our way of ensuring quality. We test systems hard to make sure they work well in real life. It’s like checking everything works before you even use it.
Let’s look at how different approaches can change things:
| Component | Basic Implementation | Optimized Approach | Performance Impact |
|---|---|---|---|
| Data Streaming | Polling requests | Event-driven callbacks | 67% latency reduction |
| Error Handling | Basic exceptions | Context-rich error codes | 42% faster debugging |
| Memory Management | Static allocation | Dynamic pool recycling | 58% memory efficiency |
| Cross-Platform Support | Platform-specific builds | Unified abstraction layer | 73% code reuse |
The real test of an SDK structure is when others use it. Our design follows proven patterns. It makes integration easy, like following a clear path.
Our validation frameworks are tough. They test systems in all kinds of real-world scenarios. From magnetic fields to sudden changes, we make sure it works when it matters most.
From Lab Coats to Locker Rooms: The IMU Revolution
We’ve explored from silicon to software, from calibration to capture. Our journey through IMU hardware and sensor fusion shows something deep. Motion analysis has moved from labs to real-world use.
IMU sensor fusion brings magic to sports. It’s not just about replacing old systems. It’s about creating new tools for sports performance that work everywhere. Fields, courts, and tracks become our labs.
Future advancements will change movement analysis with wearable IMU tech. Healthcare, training, and human-computer interaction will be transformed. The big question is how fast we’ll adapt.
Ready to go from theory to action? The tools and algorithms are ready. The applications are waiting. It’s your turn.