
In a world where athletes chase every fraction of a second, we often overlook the bigger picture. What is the true cost of that shiny carbon-fiber bike or those sleek running shoes? The reality is, these items come with a hefty environmental price tag, stretching far beyond the initial purchase. World Sailing is taking a bold step by launching a groundbreaking project aimed at measuring the environmental impact of Olympic-class boats. This initiative, the first of its kind, will conduct a life cycle analysis (LCA) across all six Olympic sailing classes.
Alexandra Rickham, Director of Sustainability at World Sailing, emphasizes the connection between sailing and a healthy ocean, stating, “Sailing depends on a healthy ocean, and that gives us both a privilege and a duty to lead.” Starting in 2032, any class seeking Olympic inclusion will need to provide an independently verified LCA. This shift could signal a turning point in how we view the environmental impact of our beloved gear.
As we dive into the nitty-gritty of this analysis, we’ll explore the phases, materials, and tools involved in understanding the full footprint of our gear. From production to end-of-life, it’s time to confront the uncomfortable truths about the items we often take for granted. Are you ready to discover the real environmental price of your game-day gear? Spoiler alert: it’s not just about touchdowns and podium finishes.
Phases: Extraction–Production–Use–Disposal
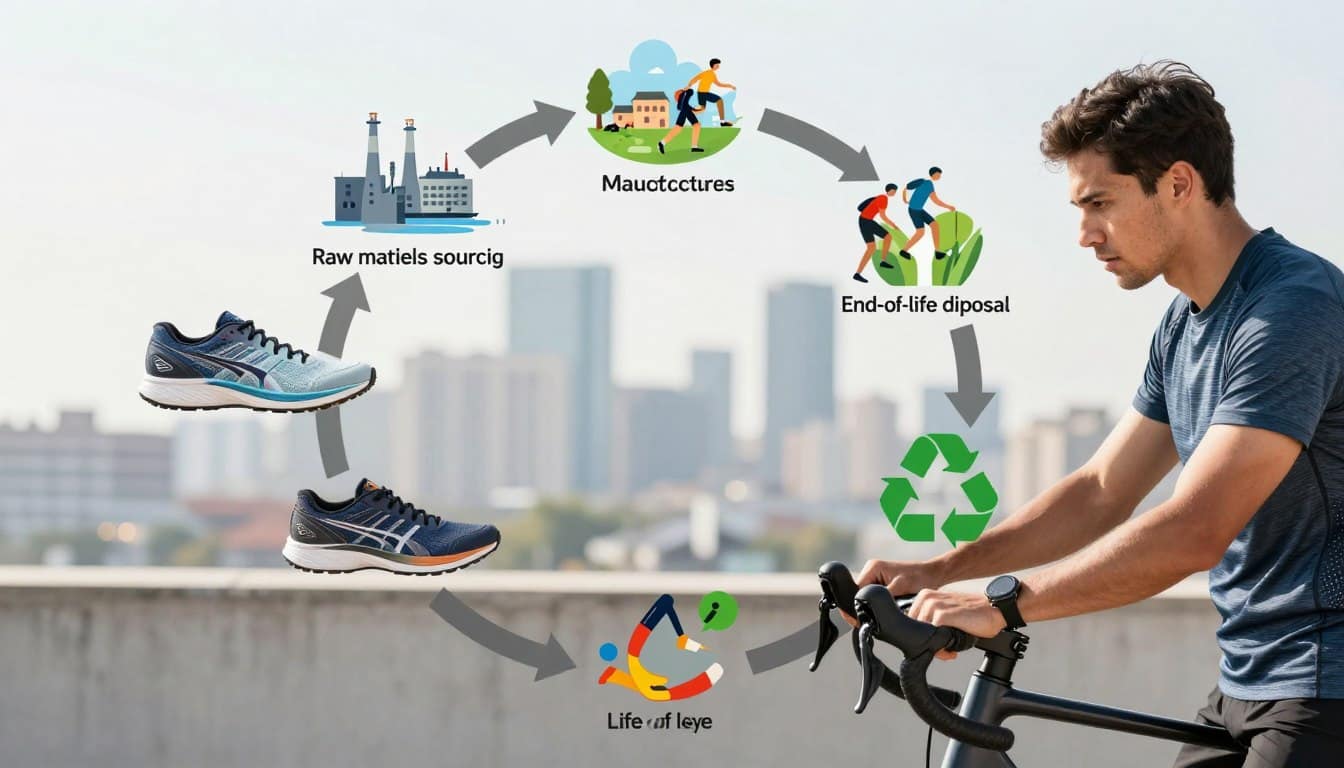
Let’s explore the four main stages of sports gear’s life cycle. Knowing these phases helps us understand the full effect of LCA sports equipment. It starts with extraction, where we take resources from the earth. This is like the beginning of a tragic story—think of bauxite for aluminum bike frames, petroleum for running shorts, and rare earth elements for smart trainers.
This first phase uses land, water, and fuel. The LCA tracks every bit of it.
Then, we move to production, where raw materials turn into the gear we know. It’s like a chemical play—carbon fiber, plastic helmets, and rubber soles are made. These processes use a lot of energy and chemicals, making the environmental impact grow. We start to see the real cost of our sports gear.
The use phase is where things get deep. A yoga mat just sits there, but a wetsuit adds to the environmental impact with every use. Even Olympic equipment’s maintenance and transport are considered, showing the carbon footprint of elite sports.
Lastly, we have disposal—the end of our gear’s life. Most of it goes to landfills because of its mixed materials. Running shoes, for example, have seven polymers, making recycling hard. Choosing between Cradle-to-Grave and Cradle-to-Gate boundaries is key for a complete impact assessment. For a full picture, Cradle-to-Grave is the only way to go.
Comparing Materials (Metal, Plastic, Bio)
Think all sports equipment materials are the same? Think again. Metals, plastics, and bio-based materials have different environmental stories. Life Cycle Analysis (LCA) shows how they impact 16 environmental areas, from climate change to resource use.
Metals, like aluminum, are popular in bikes and tennis rackets. But mining and smelting create a big carbon debt. The good news? Aluminum can be recycled endlessly. This means your old bike could become new again, but it might also become soda cans.
Plastics are another story. They’re cheap and versatile but harm the environment at the end. Your jersey’s plastic will last for generations, polluting waterways. The PEF methodology helps us see the bigger picture, not just carbon emissions.
Bio-based materials like bamboo and flax seem like a better choice. But they have their own issues. Growing hemp needs land, water, and fertilizer that could feed people. The PEF methodology helps us understand these trade-offs, avoiding “carbon tunnel vision.”
In conclusion, it’s not about which material is best. It’s about understanding the trade-offs each choice makes. A detailed report on bioplastics in sports offers more insights.
Software Tools for LCA
Let’s explore the unsung heroes of life cycle analysis: software tools. These platforms are like environmental impact detectives, doing complex math to show a brand’s ecological footprint. Tools like OpenLCA, Gabi, and Simapro are powerful but hard to use. They’re like the brainy but tough students of the software world.
Brands often pay a lot to get help with these tools. This is why only big names like Patagonia and Nike usually use them.
But, things are changing fast. Carbonfact is leading the way. It connects to a company’s systems, making life cycle analysis quick and easy. Now, brands can do assessments in weeks, not months.
In the marine world, MarineShift360 is a game-changer. It’s backed by 11th Hour Racing and focuses on boats. It knows the difference between a mainsail and a mainsail cover, which is key.
The big leap with these new tools is smart filling. When data is missing, they use machine learning to guess. It’s not perfect, but it’s a big improvement over guessing blind.
| Software Tool | Type | Key Features | Industry Focus |
|---|---|---|---|
| OpenLCA | Traditional | Complex calculations, customizable | General |
| Gabi | Traditional | Comprehensive database, detailed reports | General |
| Carbonfact | Emerging | Real-time LCA, ERP integration | General |
| MarineShift360 | Specialized | Marine-specific methodology, training | Marine |

Communicating Impact Scores
Imagine a world where your favorite sports gear has its environmental score on full display. This dream is becoming a reality in France. Starting October 2025, a new law will require all clothing sold in France to show an “Environmental Cost” score. This score will consider carbon emissions, energy use, microplastic impact, and how long the product lasts.
At first, companies can choose to share their own scores. But if they don’t, anyone can publish a score for them. This could be NGOs, competitors, or even a dedicated Reddit user. The problem is, their guesses might make your product look worse than it is.
These scores will be everywhere. You’ll see them on tags, online, and even through QR codes. As people care more about the environment, these scores will really matter when they shop.
The EU is also making sure companies are open about their environmental impact. They want accurate information shared. This means brands need to be careful about how they present their environmental data.
Brands that see LCA as a key part of their strategy will do well. They’ll tell their own stories. Others might find their products talked about by someone else.
| Score Factor | Brand’s Estimate | Third-Party Estimate |
|---|---|---|
| Carbon Emissions | 150g CO2 | 300g CO2 |
| Energy Use | 2.5 kWh | 5 kWh |
| Microplastic Impact | 0.1g | 0.3g |
| Durability | 5 years | 3 years |

Future Data Requirements
The future of sports equipment is all about data. By 2032, every sport hoping to be in the Olympics must show a detailed life cycle analysis. This change means we now see environmental impact as just as important as performance.
World Sailing’s Sustainability Agenda 2030 is leading this change. Julie Duffus, the IOC’s Head of Sustainability, says life-cycle assessments are key. This mix of environmental care and athletic achievement is a new standard.
What does this mean for sports equipment? We’ll need detailed data. Assessments will follow products from start to finish, even to the specific mine or polymer batch. Blockchain will help make supply chains clear, so people can see the environmental cost of their gear.
This change will affect more than just products. It will also cover Olympic campaigns, like athlete travel and equipment transport. These changes will help both top athletes and casual sports fans. Sustainable materials used in Olympic gear will soon be available for everyone.
The sports world is moving towards better performance and less harm to the planet. The commitment to sustainability is not just good; it’s necessary. For more on how brands like Salomon are leading with life cycle analysis, check out this resource.