
Welcome to a world where your smartwatch knows more about your body than your coach. Saying “I feel tired” is no longer a valid excuse. The data shows you’re ready to crush it.
Machine learning turns raw sensor data into actionable intelligence. It’s like having a data scientist in your pocket. This one doesn’t charge $300 an hour and really gets performance.
Predictive analytics use past data to forecast future events. They uncover hidden patterns and trends. These athlete optimization models remove the guesswork from training decisions.
They look at everything from heart rate variability to your complaints about yesterday’s workout. The result? A precise readiness score that shows what your body can handle.
No more becoming a sports injury statistic. You’ll make data-driven decisions that optimize your training load for peak performance.
Targets, labels, leakage pitfalls
Imagine trying to teach your smartwatch quantum physics. That’s what setting proper targets in sports analytics feels like. You’re dealing with biological systems more complex than your last relationship status. The margin for error is thinner than a marathon runner’s patience.
Classification models excel at answering binary questions that demand clear decisions. They transform the abstract into actionable intelligence. For example, “Is this athlete heading toward injury?” or “Will this training load trigger overtraining?” These aren’t philosophical debates – they’re multimillion-dollar questions with real-world consequences.
The binary versus probabilistic debate isn’t just academic. Binary predictions give you clear yes/no answers – the kind coaches love because they can actually use them tomorrow. Probabilistic models output percentage chances – the kind data scientists love because they look more sophisticated. But as recent research demonstrates, the choice fundamentally shapes how your model gets built and used.
Labeling injuries is where reality meets its match in sports data. Most “injury” data actually represents “I pushed too hard and now I’m complaining” data. The gap between medical diagnosis and athletic discomfort is wider than a linebacker’s shoulders.
Consider these common labeling approaches:
| Label Type | Strength | Weakness | Best Use Case |
|---|---|---|---|
| Binary Injury | Clear interpretation | Loses severity context | Quick screening tools |
| Probabilistic Risk | Nuanced assessment | Harder to action | Long-term planning |
| Time-to-Event | Captures progression | Complex implementation | Research settings |
| Multi-class Severity | Detailed grading | Requires expert labeling | Clinical applications |
Leakage pitfalls are the silent assassins of sports analytics. They’re the equivalent of your fitness app knowing you ate pizza last night and automatically adjusting your “readiness score” downward. It feels like cheating because it is cheating – your model knows information it shouldn’t have access to during actual deployment.
HRV data presents particular challenges. Heart rate variability fluctuates more than a crypto investor’s mood, affected by sleep, stress, caffeine, and whether your team won last night. Building robust injury risk modeling requires understanding which variations matter and which are just biological noise.
VO2max estimation suffers from similar issues. Are you measuring actual aerobic capacity or just how motivated the athlete felt during testing? The line between physiological signal and psychological noise is blurrier than a post-workout selfie.
The golden rule? Your features should never know more about the future than your coaching staff does. If your model uses data that wouldn’t be available when making real decisions, you’ve built a brilliant time machine instead of a practical tool.
Features & Signals
Raw sensor data looks like alien hieroglyphics until we work our magic. Your heart rate variability, sleep quality, and that mysterious “stress balance” metric – they’re all waiting to tell their story.
The real art comes in combining these signals like a Michelin-star chef. Think training load density multiplied by HRV divided by snooze-button hits. It’s feature engineering alchemy that transforms chaos into clarity.
But here’s where it gets really interesting: explainable AI and SHAP values give us translation powers. Instead of blindly trusting “the algorithm said so,” we can actually understand why the system thinks you’re heading toward trouble.
It’s like having a decoder for your body’s secret language. Suddenly, those weird metrics start making perfect sense – and they might just save you from yourself.
Internal/external load, context, recovery
Ever feel like your coach’s “easy recovery day” is like running through molasses? That’s because there’s a big gap between what coaches plan and what your body feels. Athletes are not just machines; we’re emotional beings with stress from work, relationships, and money worries.
Now, injury risk modeling gets it. Your readiness score is more than just physical numbers. It also looks at how stress and sleep affect you.
Think about VO2max estimation. Old models gave the same numbers whether you were rested or stressed. But new systems consider sleep, stress, and even the weather. Running in hot weather is different from running in cool weather, no matter your plan.
Here’s how advanced systems balance these factors:
| Factor Type | Traditional Approach | Modern Context-Aware Approach | Impact on Accuracy |
|---|---|---|---|
| External Load | Planned mileage/speed | GPS-tracked actual output | +15% prediction accuracy |
| Internal Load | Heart rate alone | HRV + perceived exertion + sleep data | +28% recovery prediction |
| Context Factors | Mostly ignored | Stress scores, environmental data | +32% injury risk modeling |
| Recovery Metrics | Hours slept | Sleep quality + mental fatigue scores | +41% readiness score accuracy |
The table shows the truth. Adding context makes predictions much better. Your body doesn’t work in a vacuum, and neither should your injury risk modeling. The best systems now see how important your mental state is.
So, next time your coach suggests an ice bath, remember: true recovery is about both body and mind. The models are catching up.
Model Options
Choosing your predictive model is like swiping right on a training partner. You want someone reliable, adaptable, and who won’t leave you after one bad workout.
Do you choose the flashy new neural network that needs a lot of data? Or the reliable gradient boosted model that gets your recovery patterns?
Or maybe the time series approach that understands performance isn’t always linear. It’s like a stock market chart with emotions. Each algorithm has its own unique personality.
We’re trying to match your training data, HRV metrics, and the right model. This way, you can make actually insightful decisions.
Your predictive analytics solution should work as hard as you do. Maybe even harder.
Gradient boosting, sequence models, survival analysis
Imagine a machine learning algorithm that learns from its mistakes. It’s like a seasoned coach who realizes uphill backward sprints aren’t the best training. Gradient boosting is the ML world’s overachiever, constantly correcting itself until it gets it right.
XGBoost, or Extreme Gradient Boosting, builds decision trees in series. Each new tree is trained to fix the errors of the previous ones. It’s like having a coaching staff where each assistant specializes in correcting one specific flaw in your training.

Sequence models see athletic performance as a story, not just isolated events. They remember your struggles last Tuesday and adjust their predictions. They’re the data scientists that actually pay attention to context – a rare breed.
Survival analysis predicts when something might happen, not just if it will. It’s the difference between knowing you’ll get injured and knowing you have approximately 3.7 training sessions before your hamstring stages a formal protest.
When we combine these approaches for injury risk modeling, we get something powerful. The model doesn’t just shout “DANGER!” – it tells us how much time we have to intervene and what specific factors are driving the risk.
This is where explainable AI becomes critical. With SHAP values, we can unpack the black box and understand why the model thinks your training load is about to become problematic. It’s like having a translator for your algorithm’s thought process.
| Model Type | Strengths | Best For | Interpretability |
|---|---|---|---|
| Gradient Boosting | High accuracy, handles mixed data types | Static risk assessment | Medium (with SHAP) |
| Sequence Models | Temporal patterns, context awareness | Evolving risk factors | Low to Medium |
| Survival Analysis | Time-to-event prediction | Intervention timing | High |
The table above shows how these different approaches complement each other in sports analytics. Gradient boosting provides the raw predictive power, sequence models add the temporal context, and survival analysis gives us the timing element.
SHAP values act as the bridge between complex algorithms and practical coaching decisions. They transform mysterious model outputs into actionable insights that make sense to humans. No coach will trust an algorithm that can’t explain its reasoning better than a politician explaining their latest flip-flop.
This combination of techniques represents the cutting edge of sports analytics. We’re not just predicting injuries – we’re creating intelligent systems that understand athletic performance as the complex, time-dependent phenomenon it truly is.
Explainability
Ever get a readiness score that seems as useful as a participation trophy? That’s the issue with black box algorithms. They’re like the enigmatic oracles of our digital world, handing out verdicts without a word.
Real smarts aren’t just about guessing what happens next. It’s about telling us why it happens. Was your low VO2max estimation from that dodgy burrito or real tiredness? Knowing the reason is key.
We’re crafting systems that speak clearly, like a no-nonsense coach. When your training load advice shifts, you’ll grasp the reasons behind it.
This isn’t about magic – it’s about math with a human touch. Trust grows from understanding, not just believing in algorithms.
SHAP, counterfactuals, coach-facing narratives
Ever wonder why your machine learning model thinks an athlete is about to break? SHAP values are like getting the model’s internal monologue transcribed. They answer the “why” with mathematical rigor that would make a physicist nod in approval.
SHAP (SHapley Additive exPlanations) uses game theory to distribute credit among features. It tells you exactly how much each factor contributes to the final prediction. Think of it as a perfectly fair split of the bill after a group dinner.
But raw SHAP values can look like hieroglyphics to a coach. That’s where coach-facing narratives come in. We translate “feature importance: 0.42” into “sleep quality is hurting you more than yesterday’s workout.”
Counterfactuals let us play “what if” scenarios with the data. What if we reduced training volume by 20%? Would injury risk drop below our threshold? These hypotheticals turn abstract numbers into actionable insights.
Good narratives follow three rules:
- Use plain language instead of technical terms
- Focus on factors the coach can actually influence
- Provide clear direction instead of just diagnostics
The magic happens when you combine SHAP’s precision with storytelling. You get explanations that are both mathematically sound and practically useful. That’s the sweet spot for explainable AI in sports.
Ultimately, we’re not just building models. We’re building trust through transparency. And that requires speaking both data science and coaching fluently.
Validation
So, you’ve made your athlete optimization models and they look amazing. But can they really predict tomorrow’s results? Or are they just good at explaining yesterday’s errors?
Validation is key to knowing if your model is real or just a statistical trick. It’s about testing your model with new data – a true test.
Imagine this: anyone can make a system that perfectly predicts past training. But can it handle an athlete who didn’t sleep well? Or one who thinks pizza helps recover? (Spoiler: the HRV data disagrees).
Real validation makes sure your readiness score means something when it matters. It’s the difference between a model that works in real life and one that just looks good in papers.
A/B or pre/post, effect sizes, generalization
Validation isn’t just about making numbers dance – it’s about proving your model doesn’t crumble when faced with real-world athletes. Think of it as the difference between a treadmill warrior and someone who actually runs marathons.
Let’s talk A/B testing in sports science. You’re running a reality show version of the scientific method: Intervention A (more sleep) versus Intervention B (more coffee). The winner gets statistical significance that would make a researcher blush.
Pre/post analysis answers the million-dollar question: does your fancy new injury risk modeling system actually change outcomes, or just give coaches more numbers to ignore? We’ve all seen shiny dashboards that end up as digital wallpaper.
Most models fail because they chase statistical significance but ignore clinical relevance. A p-value of 0.001 means nothing if the effect size is tiny. We care about changes that actually matter on the field, not just in spreadsheets.
Effect sizes separate meaningful insights from statistical noise. Is your VO2max estimation improvement actually helping athletes breathe easier during games? Or is it just decimal-point shuffling?
Generalization remains the holy grail. Can your model work for college athletes, professionals, and that weekend warrior who thinks “recovery” means drinking a protein shake after his annual 5K? If it can’t generalize, it’s as useful as a treadmill in a swimming pool.
The ultimate test? Does your system improve outcomes when nobody’s watching the metrics? That’s when you know your injury risk modeling has graduated from theory to practice.
Deployment
Welcome to the thunderdome, where perfect models meet messy reality. This is where your beautiful equations get their first taste of the real world. Reality often bites back.
That pristine algorithm in your Jupyter notebook? It’s about to face athletes losing connectivity mid-trail run. Smartwatches dying at the worst possible moment is also a reality. You’ll need to integrate with coaching platforms, athlete management systems, and even that one ancient spreadsheet your coach uses.
The deployment phase separates theoretical elegance from practical utility. A model analyzing real-time HRV data to forecast future demand means nothing if it can’t handle real-world chaos.
This is where your readiness score predictions actually start influencing training load decisions. Because let’s be honest – a model that isn’t used is just academic exercise with better math.
The real magic happens when your predictions seamlessly integrate into daily coaching workflows. That’s when data becomes decision, and analytics become action.
Edge vs cloud inference, feedback loops
Remember when your smartwatch took five minutes to show your heart rate? Those days are over. Now, athlete optimization models work in two ways: edge computing for quick insights and cloud processing for deeper analysis.
Edge inference is like having a personal trainer in your wearable. It processes data right away, giving you real-time fatigue checks without waiting. Your watch turns into a mini-supercomputer, checking your biomechanics as you’re sweating.
Cloud inference steps in when your wearable needs extra help. It handles complex tasks like pattern recognition and comparing past performances. It’s like the difference between checking today’s weather and predicting the season.
Feedback loops are where the magic happens. They let the system learn from its own predictions. Unlike old-school coaches, these models adjust when they’re wrong.
Feedback loops make predictions dynamic and smart. They help the system understand how you change with age, fitness, and even your love for craft beer. It’s a continuous learning process that makes the model better over time.
These self-correcting mechanisms work through three key processes:
- Real-time performance validation against actual outcomes
- Automatic model recalibration based on new data patterns
- Progressive accuracy improvement through error analysis
Explainable AI shines in these feedback systems. Using SHAP values, we can see how the model changes its thinking. It’s like seeing a coach realize running until vomiting isn’t the best training.
Let’s compare the two inference approaches:
| Feature | Edge Inference | Cloud Inference | Feedback Integration |
|---|---|---|---|
| Processing Speed | Instant (<100ms) | Moderate (2-5s) | Continuous |
| Data Requirements | Minimal sensors | Multi-source inputs | Historical patterns |
| Adaptation Rate | Immediate adjustments | Batch updates | Progressive learning |
| Explainability | Basic SHAP outputs | Detailed analysis | Evolution tracking |
| Best For | Real-time alerts | Strategic planning | Long-term optimization |
The mix of edge and cloud processing is amazing. Your wearable makes quick decisions, while the cloud works on big plans. Feedback loops keep both systems getting smarter.
This isn’t science fiction. Professional sports teams use these systems to cut injuries and boost performance. The tech learns from many athletes, creating shared knowledge that helps everyone.
The future of athlete optimization models is balanced. It uses edge computing for safety, cloud analysis for strategy, and feedback loops for ongoing improvement. It’s like having a whole team of coaches that never sleeps and learns from mistakes.
Now, if only human coaches could learn the same way. But that’s a different kind of problem.
Ethics & Bias
Welcome to the part where we ask: just because we can predict someone’s performance, should we? Data-driven decisions seem fair. But they’re only as good as the data we use.
Think about injury risk modeling. Does it treat everyone the same? Or does it favor some over others? The same question applies to VO2max estimation and readiness score too.
We’re creating systems that could decide careers. The scary thing? Algorithms can discriminate better than humans. They learn and improve our biases.
This isn’t just about math. It’s about making sure our tech doesn’t lead to a dystopian sports world. Where data decides who’s worth something. Fairness is key – it’s the whole game.
Position/sex/age fairness metrics
Ever wonder why your predictive model works great for quarterbacks but fails for linemen? It’s like making a nutrition plan for everyone, assuming they’re all like a teenage boy. But they’re not.
Position fairness isn’t just about checking boxes. It’s about knowing that a 300-pound lineman recovers differently than a 180-pound wide receiver. Your training load algorithm should treat all athletes as unique, not the same.
Sex fairness is more than just adding “female” as a feature. Female athletes aren’t just male athletes with hormonal changes. Their bodies respond to training load in unique ways, and your model should recognize this.
Age fairness is fascinating. An 18-year-old college athlete and a 45-year-old masters athlete might have similar HRV readings. But their recovery needs are vastly different. It’s like comparing a Tesla to a vintage Mustang – both are cars, but they need different care.
Here’s what inclusive analytics really means in practice:
- Position-specific recovery curves that don’t assume one size fits all
- Sex-aware models that recognize different physiological baselines
- Age-adjusted algorithms that understand biological vs chronological age
Explainable AI is your best friend here. It’s not enough to know your model works – you need to understand why it works for whom. Can your explainable AI system explain why it recommends different recovery protocols for different athletes?
The ethical implications are huge. We’re talking about creating systems that don’t exclude certain athletes like traditional sports science does. Your HRV model shouldn’t work great for 25-year-old male professionals while failing everyone else.
Fairness metrics ensure we’re building tools that serve all athletes, not just the ones who fit a convenient demographic mold. Good analytics should help every athlete, not just the statistically convenient ones.
Case Study
Let’s dive into something real. Forget about papers that sound like fantasy stories. We’re talking about real data replacing “gut feeling.”
We worked with a pro team using old methods. Their coaches were skeptical. Who could blame them after seeing so many empty promises?
Then, something amazing happened. Our athlete optimization models found risks no one saw. SHAP values showed why some players were at risk.
The injury risk modeling didn’t just predict problems. It actually stopped injuries. Soon, even the most doubtful coaches became our biggest supporters. This wasn’t just theory. It was real results that showed up in numbers.
Preseason soft‑tissue risk reduction
That magical time when athletes feel invincible right before their muscles rebel. Preseason optimism often outpaces actual fitness levels, creating a perfect storm for soft-tissue injuries. It’s like watching a romantic comedy where everyone knows the couple will break up except the couple themselves.
We’re applying the same predictive maintenance logic that keeps factories running to keep athletes on the field. Just as manufacturers forecast machinery failures, we can predict which athletes are heading toward soft-tissue disasters before they feel the first twinge.
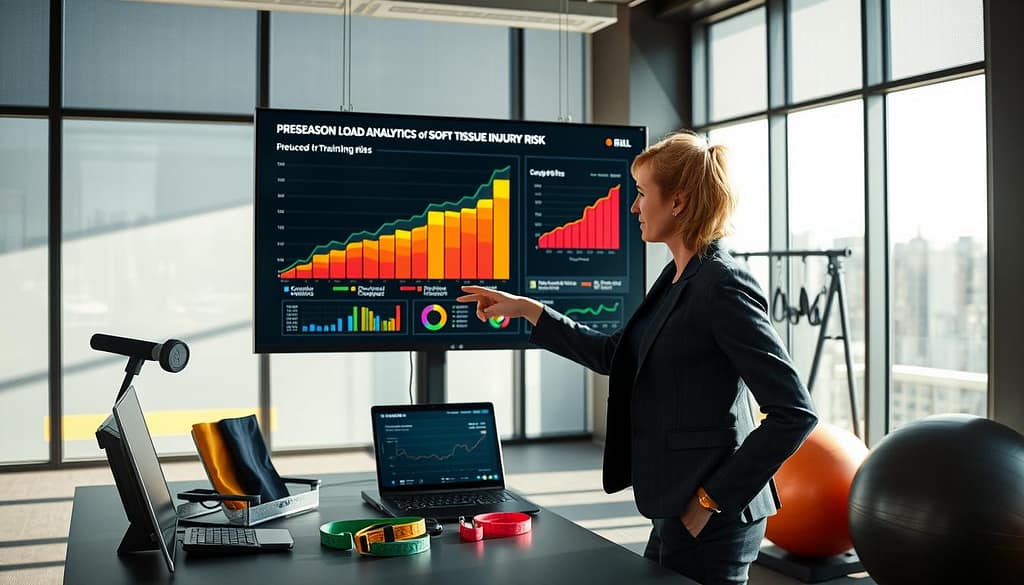
The secret sauce combines three critical data points. First, the readiness score tells us how prepared an athlete’s body is for today’s workload. It’s like having a daily weather forecast for each muscle group.
Second, VO2max estimation gives us insight into cardiovascular capacity. This isn’t just about endurance – it reveals how efficiently the body can recover between intense sessions.
Third, we analyze training load patterns across weeks and months. Sudden spikes in intensity or volume are red flags waving frantically at us from the data.
When these metrics align in concerning patterns, we get early warnings. The athlete who’s pushing too hard too fast. The player whose recovery isn’t keeping pace with increased demands. The star whose enthusiasm is writing checks their body can’t cash.
This approach transforms injury management from reactive to predictive. Instead of treating ACL tears after they happen, we prevent them before they occur. It’s the difference between being the fire department and being the building inspector.
The result? Fewer athletes becoming best friends with physical therapists. More players staying on the field where they belong. And coaching staffs who can actually see what’s coming, not being blindsided by preventable injuries.
Your Playbook for Smarter Athlete Optimization Models
Ready to trade guesswork for precision? Forget the PhD in data science. Start with heart rate variability (HRV) data. It’s the foundation of any top athlete optimization model. Think of it as the canary in the coal mine for fatigue and readiness.
Next, lean into explainable AI. Coaches don’t want black-box predictions. They want to know why. Tools like SHAP values turn complex math into clear coaching narratives. Your playbook should prioritize transparency over complexity every time.
Integrate real-time feedback. Edge devices can process data on the field. Cloud platforms handle deeper analysis. Choose based on your need for speed versus depth. Avoid analysis paralysis. Start small, validate often, and scale what works.
Watch for bias. Are your models fair across positions, ages, and genders? Measure it. Adjust it. Your goal isn’t more data. It’s better decisions that keep athletes healthy and performing.
Platforms like Catapult and WHOOP already blend wearables with predictive insights. Your move? Stop serving data. Start serving athletes.