

Remember that scene in Moneyball where Brad Pitt realizes he’s been looking at baseball all wrong? That’s where we’re starting our journey—except instead of scouts, we’ve got sensors.
Welcome to the big leagues of athletic intelligence, where raw movement becomes championship insight. We’re talking about transforming chaotic field information into coherent, actionable intelligence.
Modern teams use everything from BLE sensors to cloud analytics. They’re turning sweat into data dividends that would make even traditional coaches love numbers.
This isn’t just nice-to-have technology. It’s the difference between guessing and knowing. Between hoping and executing.
So grab your clipboard. We’re about to break down how the pros build their ingestion pipeline for maximum impact.
BLE/MQTT topics, retries, buffering
Think of your data pipeline as a team’s nervous system. If signals don’t get through, it’s like coaching blindfolded. BLE gateways are your MVPs, collecting data while saving battery life.
MQTT topics are your playbook. They’re lightweight and efficient, perfect for unreliable networks. And let’s face it, stadium Wi-Fi can be as unpredictable as a rookie under pressure.
When connections fail (and they will), your retry strategy must be strong. Here are three ways to handle failures:
- Exponential backoff: Wait longer between tries, giving your system room to breathe.
- Dead letter queues: Store bad messages for later review, like analyzing game footage.
- Circuit breakers: Stop system overload, like calling a timeout in a bad drive.
Buffering is your safety net, making sure no data is lost. It’s like having a reliable backup quarterback.
Modern IoT sports platforms use this combo for real-time monitoring. BLE gateways collect data from wearables, and MQTT sends it to processing systems.
The outcome? A system that would impress Bill Belichick. It’s methodical, fault-tolerant, and efficient.
Time Sync
Imagine if every clock in your life had its own timing. Your alarm, reminders, and even the microwave timer were all off. It would be chaotic, right? Now, think about this chaos in sports.
We’re not just talking about clocks here. We’re talking about microsecond precision. This is the kind of timing that Olympic officials would approve of. The difference between a record and a “nice try” can be tiny.
The NFL’s Next Gen Stats system uses this level of time synchronization. It tracks everything from receiver separation to quarterback release times. When all data streams are in sync, you get real insights.
Getting this right is more important than making the right call on fourth down. Proper time synchronization makes chaotic data streams into clear stories worth analyzing.
PTP/NTP, drift handling, event markers
Imagine a basketball player’s jump shot data being out of sync—it’s like a traveling violation in analytics. When every millisecond matters, your timing protocols need to be as precise as a Steph Curry three-pointer.
PTP (Precision Time Protocol) is like LeBron James in time sync—it’s expensive but offers top-notch precision. It’s perfect for high-speed motion capture and real-time analytics.
NTP (Network Time Protocol) is like a reliable sixth man—it’s cost-effective and works well for most training needs. It provides millisecond precision, meeting 90% of sports data needs without costing too much.
Drift handling is key to being a pro. Even the best clocks can drift off like a rookie missing defensive assignments. We use algorithms to correct timing errors before they happen, like predictive defense for your data.
Our drift compensation techniques include:
- Linear regression models that predict clock skew patterns
- Adaptive filtering that adjusts in real-time like a point guard reading defenses
- Cross-device synchronization that keeps sensors in perfect harmony
Event markers are like the instant replay system for your data. They timestamp actions with the precision of a tennis line judge’s call. They record moments like when a baseball leaves a pitcher’s hand or a soccer player’s foot strikes the ball, creating synchronized data stories.
| Protocol | Precision | Ideal Use Case | Implementation Cost |
|---|---|---|---|
| PTP | Microsecond | Professional sports analytics | High |
| NTP | Millisecond | Training facilities & academies | Low |
| GPS Time Sync | 10-100ms | Outdoor field sports | Medium |
| Hardware Timestamping | Nanosecond | Research & development | Very High |
The right time sync approach depends on your needs. Are you aiming for Olympic-level competition or just weekend warrior analytics? Your choice determines whether you need LeBron’s precision or reliable bench depth.
Remember, in sports data, timing is everything. It’s what makes insights usable and not just digital noise. Get your time sync right, and everything else falls into place like a perfectly executed fast break.
Storage Architecture
If data ingestion is your offense, storage architecture is your championship defense. We’re building the digital equivalent of a perfectly organized equipment room. Every piece of information has its place.
This isn’t about throwing cloud buckets at the problem and hoping for the best. It’s about designing a system that understands the difference between real-time analytics needing instant access and historical trends for deep analysis.
Think of it as constructing the ultimate library—where every play, heartbeat, and movement gets perfectly cataloged for immediate recall. The right storage architecture doesn’t just hold your data; it makes it work for you.
Raw lake, curated warehouse, feature store
Think of sports data storage like building a championship roster. You need raw prospects, developed veterans, and specialized role players. Each storage layer has a unique role in turning athlete performance data into useful insights.
The raw data lake is like your practice field. It takes in all data without filtering. This includes sensor data from wearables, GPS trackers, and biometric monitors. It’s like a place where everything is raw and unpolished.
InfluxDB shines in handling this raw data. It’s like a quarterback reading defenses, managing the flow of data. The raw lake doesn’t judge data quality. It just captures everything for later use.
The curated warehouse is where data gets cleaned and organized. It’s like preparing game-ready intelligence. Here, data is structured for analysis, and errors are fixed.
TimescaleDB excels in this curated environment. It turns raw data into polished performance statistics. This is like the training facility where raw talent is developed.
The feature store is your specialized training ground for machine learning. It’s where pre-processed data features live for model training and inference. It’s like a place where data scientists can work with refined data.
Both InfluxDB and TimescaleDB support feature storage, but they differ. The choice depends on your specific needs.
| Feature | InfluxDB | TimescaleDB | Best For Sports Use Case |
|---|---|---|---|
| Data Ingestion Rate | Extremely high | Very high | Live game sensor streams |
| Query Flexibility | Good | Excellent | Historical performance analysis |
| SQL Support | Limited | Full | Traditional analytics teams |
| Downsampling | Native feature | Requires setup | Long-term trend analysis |
| Machine Learning Integration | Growing | Strong | Predictive athlete analytics |
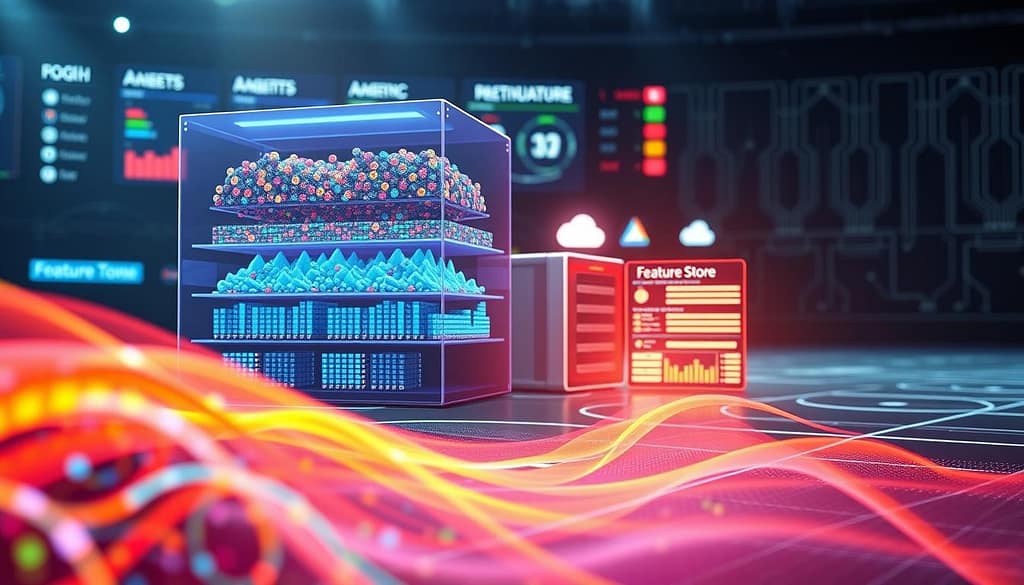
Choosing between these databases isn’t about picking a winner. It’s about selecting the right tool for each storage layer. Some organizations use both—InfluxDB for raw ingestion and TimescaleDB for curated analysis.
The storage trifecta separates weekend warriors from professional sports organizations. Get this architecture right, and your analytics will perform like a well-coached championship team. Get it wrong, and you’re just collecting fancy numbers that never make the starting lineup.
Processing
Think of athletic information like raw footage from a hundred cameras. It’s overwhelming. The real magic happens when we filter out the noise to find the game-changing moments.
The NFL’s Next Gen Stats system is amazing. It crunches numbers every tenth of a second during combine drills. That’s like finding a needle in a haystack the size of a stadium.
This isn’t about brute force. It’s about smart analysis. We’re talking about separating the Tom Bradys from the backup quarterbacks. It’s knowing what to keep, what to discard, and what to transform into coaching gold.
Raw sensor readings become meaningful insights. Thousands of points per second get transformed into actionable intelligence. That’s how you turn chaos into clarity.
Stream vs batch, windowing, labeling
Ever watched a coach make a halftime adjustment that completely changes the game? That’s stream processing in action. Or seen analysts break down an entire season to identify patterns? Welcome to batch processing territory. In sports analytics, we need both the live reaction and the deep study.
Stream processing handles data as it arrives—like tracking player movements during a game. It’s the digital equivalent of a coach screaming adjustments from the sidelines. Batch processing works with historical data, analyzing entire seasons or tournaments. It’s the film room session where every play gets dissected.
Windowing techniques create meaningful time segments from continuous data streams. Think of breaking a basketball game into quarters or a soccer match into halves. Fixed windows use consistent time intervals. Sliding windows overlap to show progression. Session windows capture complete activities—like an entire offensive possession.
Labeling transforms raw sensor data into actionable insights. That’s not just “player moved left”—it’s “explosive lateral acceleration during defensive coverage.” Proper labeling turns chaos into clarity, much like how good coaching turns raw talent into championship teams.
| Processing Type | Best For | Latency | Sports Equivalent |
|---|---|---|---|
| Stream Processing | Real-time decisions, live analytics | Seconds to minutes | Halftime adjustments |
| Batch Processing | Historical analysis, trend identification | Hours to days | Off-season film study |
| Micro-batch | Near-real-time with consistency | Minutes to hours | Quarter-by-quarter analysis |
The ETL vs ELT debate gets interesting here. Extract, Transform, Load (ETL) processes data before storage—like pre-game preparation. Extract, Load, Transform (ELT) stores raw data first, then transforms it—more like recording the entire game and analyzing later. Both approaches have their place in the playbook.
Modern platforms often blend both approaches. They might use stream processing for immediate coaching decisions while running batch jobs overnight for deeper analysis. It’s not about choosing one over the other—it’s about having the right tool for each situation.
The best systems handle this processing with the efficiency of a well-executed fast break. They transform chaotic sensor data into structured, analyzable information that actually helps coaches win games. Because at the end of the day, that’s what matters—turning data into victories.
Analytics Access
What good is a brilliant playbook if nobody can read it? Building a sophisticated system is only half the battle. The real victory comes when the right people can actually use it.
Think about the NFL’s Combine IQ system. Coaches need live substitution advice. Medical staff require instant injury alerts. Executives demand clear ROI calculations. Each role needs a different view.
We design for clarity, not clutter. Your dashboard shouldn’t feel like a complicated control panel. It should be as intuitive as a well-designed play and as responsive as an all-star athlete. The right insight finds the right person at the perfect time.
That’s the final piece of the puzzle. It turns raw numbers into a competitive edge.
APIs, notebooks, BI dashboards
Observability
Think of your data system like a star athlete’s training regimen. You wouldn’t just hope they’re in shape for the big game, right? You’d track every heartbeat, every sprint, every metric. That’s observability.
It’s your system’s personal fitness tracker. It constantly monitors health and spots issues before they become big problems. If you’re not measuring your measurement tools, you’re just guessing. And as any coach will tell you, guessing leads to losses.
This is about moving from reactive panic to proactive confidence. It’s the difference between having a reliable veteran and an unpredictable rookie running your most critical operations. You get a clear, real-time view of everything from ingestion to visualization.
Ultimately, it’s what keeps your entire operation in game-ready condition. No more surprises. Just peak performance.
Tracing, metrics, alerts, SLOs
Ever feel that sinking feeling when your data pipeline fails? It’s like watching a football game where the ref misses a clear penalty. Without observability, you’re left guessing what went wrong.
But there’s good news. We can learn from sports analytics platforms. They track every detail, measure performance, and set clear goals for success.

Distributed tracing is like your all-22 film review for data flow. It tracks every byte through your system, like cameras on a touchdown pass. You see the whole journey, not just the end result.
Performance metrics are your stat sheet. They measure everything from data freshness to speed. It’s like having your completion percentage and yards-per-carry in one dashboard.
Alerting systems are your coaching staff yelling from the sidelines. They alert you to issues fast, like Bill Belichick spotting a defensive weakness. No more learning about problems after the game.
Service level objectives define what “good performance” means for your system. They’re your win-loss record, showing if your data pipeline is valuable.
When you combine these four, you create a feedback loop that would impress any NFL coach. You’re not just collecting data; you’re gaining insights.
Remember, observability isn’t about more dashboards. It’s about having the right info at the right time for the right decisions. Just like in sports, the best systems are built on preparation, not luck.
Edge Cases
You’ve built the perfect system. It works flawlessly in testing. Then reality hits like a linebacker blitzing from the blind side.
What happens when an athlete’s sensor goes dark during the game-winning drive? How do you capture information when the team plays in the middle of nowhere with spotty connectivity?
These aren’t theoretical problems—they’re the trick plays of real-world implementation. I’ve seen systems fail because they couldn’t handle duplicate entries or offline scenarios.
The difference between a theoretical solution and a practical one comes down to anticipating the unexpected. It’s about building systems that handle edge cases with the grace of a veteran quarterback reading a complex defense.
Real professional implementations require robust backfill capabilities and duplicate management. Because in the messy reality of competition, anything that can go wrong eventually will.
Offline capture, backfill, duplicates
Ever tried streaming a game from a stadium basement? Welcome to the world of offline data capture. When connectivity drops, your pipeline needs to handle it like a pro.
Offline capture isn’t just about storing data locally. It’s about smart buffering, intelligent retries, and knowing when to hold ’em versus when to fold ’em. It’s like a quarterback calling an audible at the line of scrimmage.
Backfill procedures are where things get really interesting. Missing data? No problem. It’s like instant replay for your analytics—reconstructing what happened with forensic precision. The key is implementing idempotent processing that can handle replayed data without creating duplicates.
Which brings us to everyone’s favorite party crasher: duplicate data. Sensors double-reporting? Devices reconnecting? It’s the data world’s version of that friend who tells the same story twice—annoying but manageable.
Here’s how championship teams handle these challenges:
- Offline-first design: Assume connectivity will fail at the worst possible moment
- Smart backfill triggers: Automated detection of data gaps with manual override capabilities
- Duplicate fencing: Using unique identifiers and timestamp checks to prevent data doubles
The real magic happens when you combine these strategies. It’s not about building the perfect system—it’s about building a resilient one. One that can recover from setbacks faster than a cornerback after a missed tackle.
Because in data pipelines, as in sports, it’s not about whether you’ll face challenges. It’s about how elegantly you recover from them.
Reference Implementation
Every great coach studies successful plays. Every great engineer studies successful implementations. We’re giving you the championship playbook.
This section combines proven strategies from real-world IoT platforms and cloud infrastructure. We’ve analyzed system integration approaches from professional organizations.
Think of this as your architectural blueprint. It’s been tested in actual game conditions, not just theoretical scenarios.
You’ll get a coherent, workable system that adapts whether you’re tracking high school athletes or professional superstars. No reinventing the wheel – just proven patterns that deliver results.
This isn’t academic theory. It’s the real deal, ready for your organization’s specific needs. Let’s build something that actually works.
Cloud diagram + IaC snippets
Let’s face it – nobody really reads architecture documents. We all just jump straight to the diagrams. Here’s a quick guide to building a sports analytics platform that’s reliable.
This architecture is more than just pretty pictures. It’s like a detailed football playbook. Data flows from edge devices, through ingestion layers, and into real-time streams. It’s then stored and served to coaches through advanced dashboards.
But diagrams are just the start. The real magic happens when you use infrastructure-as-code. Manually clicking through cloud consoles is like trying to coach from the bleachers – it’s not effective.
AWS Terraform Snippet
Here’s how to set up your Kinesis data stream for athlete metrics. It includes handling retries and buffering:
resource "aws_kinesis_stream" "athlete_metrics" {
name = "player-performance-stream"
shard_count = 4
retention_period = 48

tags = {
Environment = "production"
Sport = "basketball"
}
}
Azure Bicep Template
For Microsoft fans, here’s your Event Hub deployment with redundancy:
resource eventHub 'Microsoft.EventHub/namespaces/eventhubs@2021-11-01' = {
name: 'player-telemetry-hub'
properties: {
partitionCount: 8
messageRetentionInDays: 3
}
}
GCP Deployment Manager
And for Google Cloud fans, here’s your Pub/Sub setup with alerting:
resources:
- type: gcp-types/pubsub-v1:projects.topics
name: athlete-data-topic
properties:
topic: athlete-data-topic
labels:
data-type: performance-metrics
retention: 72h
These snippets are more than code. They’re your playbook for scalable infrastructure. Just change the sport tag and adjust the shard count for your athlete volume.
The beauty of IaC is version control for your infrastructure. Roll back changes quickly and test new setups without risking your environment. It’s the difference between hoping your architecture works and knowing it will.
So, copy these snippets, modify them for your sport, and deploy with confidence. Your cloud architecture should be as well-trained as your athletes – every component knows its role and performs flawlessly under pressure.
From Blueprint to Championship Playbook
Your sports data pipeline is more than just a trophy. It’s about winning the real game. Start with a pilot program in a key area, like injury prediction or tactical analysis. Make sure it works before you expand.
Next, link your feature store with machine learning models. This is your team’s brain. NBA teams cut injuries by half with load management analytics. Liverpool used computer vision to understand opponents’ strategies.
Full production means connecting all data sources. Your feature store turns numbers into insights. Major League Baseball’s pitch tracking improved player health and performance.
This isn’t about replacing coaches with algorithms. It’s about using agentic AI that learns and adapts in real time. Your goal is to make every decision a winning choice.