
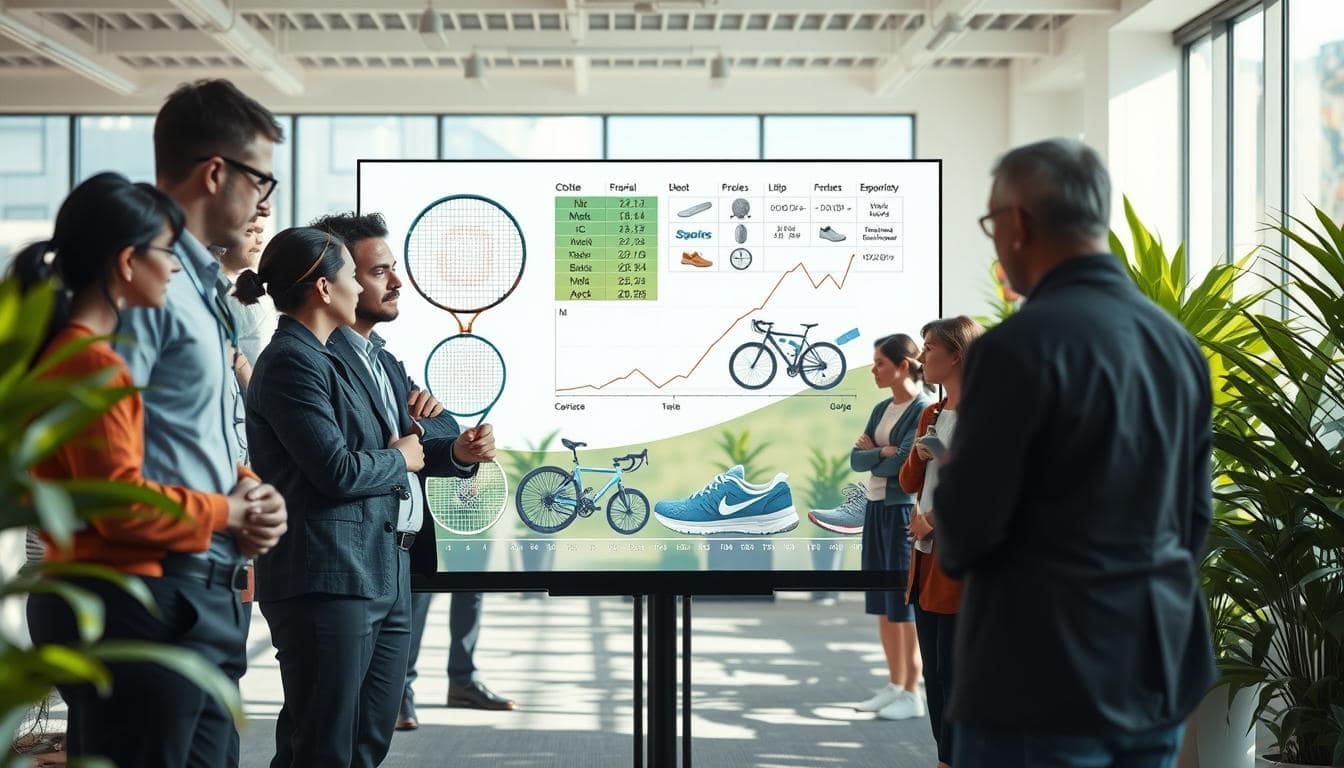
Starting a project without a clear goal is like trying to score a three-pointer with a bowling ball. In the world of LCA sports, setting clear boundaries is key. Are we looking at cradle-to-gate, stopping at the factory door, or cradle-to-grave, following the product to its end? This choice is very important.
Think about defining your functional unit. It could be “1,000 miles of running in a size 10 shoe” or “one season of weekly hockey play.” Each choice affects your CO2e calculation. For example, a bike used daily in Portland has a different impact than one rarely used in Phoenix.
Without clear parameters, your CO2e numbers won’t be very helpful. As we go through this guide, remember: being clear and precise is essential. Let’s figure out how to make sense of it all.
Data sources Ecoinvent GaBi EPA and supplier specific EPDs data quality ranking
The quality of your data is key in lifecycle assessments. In the world of material and process datasets, being precise is essential. Ecoinvent is like a Swiss watch, reliable and detailed. GaBi is like a seasoned traveler, skilled in navigating complex supply chains.
The EPA offers a wealth of databases for free. They’re like a friendly neighbor who always welcomes you. But, supplier-specific Environmental Product Declarations (EPDs) are the top choice. They’re the gold standard, provided your supplier hasn’t just added a logo to a generic report.
So, how do we sort through this data jungle? The data quality ranking is like a pedigree matrix. It helps us find the reliable data. If your datasets are full of assumptions and half-truths, your CO2e rollup won’t be trustworthy.
- Ecoinvent: Known for its accuracy and wide coverage.
- GaBi: Great for complex supply chain modeling.
- EPA Databases: Free and easy to use, but quality varies.
- Supplier-specific EPDs: Best for detailed, tailored assessments.
In summary, we should carefully select our data like a museum curator. The quality of your LCA depends on your datasets. So, choose wisely, and remember: garbage in, garbage out.
Modeling approach recipes for boards shoes bats helmets textiles and bikes
Creating a life cycle analysis for sports gear is like writing a symphony. Each piece of equipment has its own special recipe. If you get it wrong, it sounds bad.
For example, a running shoe has twelve materials, eight processes, and travels from Ho Chi Minh City to Kansas. That’s a lot of parts!
Let’s talk about a baseball bat. The CO2e calculation depends on whether it’s made of aluminum or ash. Aluminum is energy-intensive but recyclable, while ash has biogenic carbon but lasts shorter.
Helmets are another story. The foam and shell mix is a big environmental impact area.
Textiles for jerseys have a long story of water use and dyeing. And bikes? Carbon fiber frames are a mix of performance and sustainability challenges.

To show these complexities, let’s look at a comparison table. It summarizes materials, processes, and logistics for different sports equipment:
| Equipment Type | Materials | Processes | Logistics |
|---|---|---|---|
| Snowboard | Wood core, P-Tex base | Shaping, laminating | Factory to retailer |
| Running Shoe | Mesh, rubber, foam | Cutting, stitching | Ho Chi Minh City to Kansas |
| Baseball Bat | Aluminum or ash | Forging, finishing | Local distribution |
| Helmet | Foam, polycarbonate | Molding, assembly | Direct shipping |
| Bike | Carbon fiber, aluminum | Frame construction | Global sourcing |
Understanding these recipes helps make sure your model is good. Each part’s details are key to the environmental impact. This makes the CO2e calculation show the value of careful design and material choice.
Hotspots material vs process vs logistics vs use phase vs end of life
In LCA sports, finding hotspots is like searching for hidden treasures. What really affects the environmental impact of sports gear? It’s not always what you think. For example, the real issue with surfboards isn’t the wax, but the polyurethane blank.
Materials like carbon fiber use a lot of energy. But the process of making the gear can be even more energy-intensive. Take injection molding, for instance. The energy needed to ship a container from Shenzhen to Savannah is huge. It’s a classic case of “who’s really to blame?”
The use phase also has a big impact. Washing a polyester jersey 50 times can double its environmental impact. And at the end of life, incinerating gear releases all that carbon in a puff of irony. Imagine the environmental impact of a bike, where the assembly step is small, but the rider’s extra calorie consumption from a heavier frame is significant.
Hotspot analysis is where the story gets juicy. Understanding these nuances is key for engineers to reduce the carbon footprint of sports equipment. If you want to learn more, check out this insightful article on LCA in fashion and textiles. It’s all connected!
Sensitivity tornado charts uncertainty Monte Carlo and rebound effects
Imagine poking your model with a stick and watching it dance; that’s sensitivity analysis in action. It’s like a bar graph that shouts, “Look at me! This variable matters more than your quarterly bonus!” Here, we dive into the nitty-gritty of how small changes can lead to big differences in our CO2e calculation.
First up, let’s talk about tornado charts. These visual aids help us identify which variables have the most significant impact on our outcomes. Picture a tornado: the most potent winds are at the top, just like the variables that sway our results the most. For instance, if we swap coal for hydro in our energy mix, the footprint could plummet, showing how sensitive our models can be.
Next, we have Monte Carlo simulations. Think of it as rolling the dice 10,000 times to account for uncertainty. This method allows us to see how likely it is that a supplier’s claim of “maybe it’s recycled” holds water. It’s not just about what we expect; it’s about what could happen in a world of unpredictability.
Now, let’s not forget the rebound effect, often likened to the Jevons paradox of sports gear. You create a lighter bike, and suddenly, riders feel empowered to go on longer rides. This could mean they burn more energy, potentially offsetting the savings we thought we achieved. It’s the LCA equivalent of a plot twist in a Christopher Nolan film!
To illustrate these concepts, we’ve put together a table summarizing the impacts of various factors on CO2e calculations:
| Variable | Impact on CO2e Calculation | Example |
|---|---|---|
| Energy Source | High | Coal vs. Hydro |
| Material Type | Medium | Recycled vs. Virgin |
| Usage Patterns | Variable | Short vs. Long Rides |
By understanding these dynamics, we can better navigate the complexities of life cycle assessments. So, let’s chart it all out, ensuring we have the insights needed to sleep soundly at night!
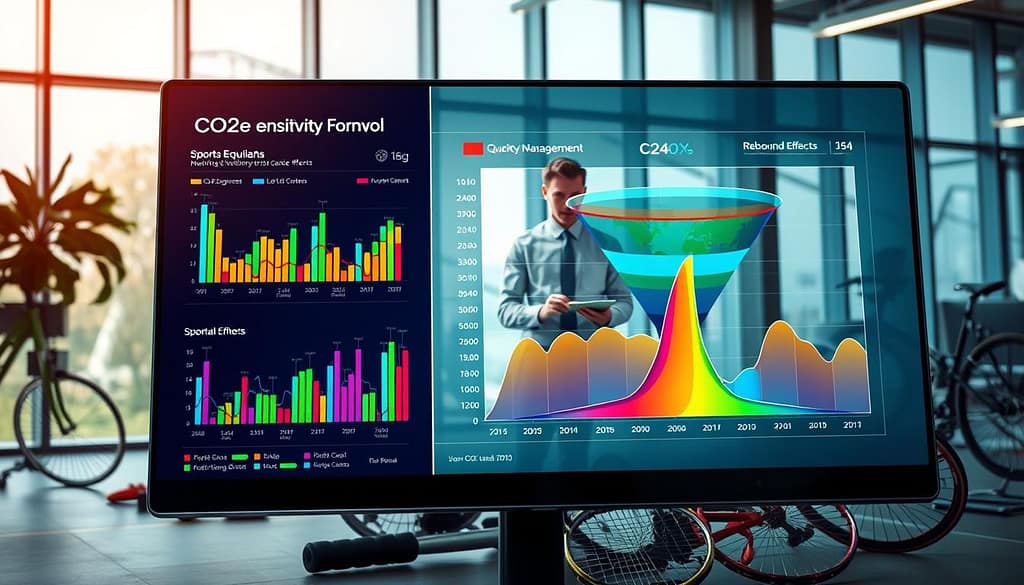
PLM integration BOM sync automated CO2e rollups and change notices
Imagine a world where your PLM system alerts you about carbon footprints before you buy. This isn’t just a dream; it’s real with PLM integration. It syncs your Bill of Materials (BOM) with lifecycle assessments, alerting you to CO2e changes. It’s like having a carbon accountant in your CAD software, warning you about emissions.
The partnership between Autodesk and the New England Patriots and Cleveland Browns is a great example. They use a design-and-make platform that combines Building Information Modeling (BIM) with lifecycle data. This is what we need for sports equipment, making sure every design choice is sustainable.
Without integration, teams often struggle. I’ve seen engineering and sustainability BOMs kept in separate spreadsheets. These were managed by different people who hadn’t spoken in years. With PLM integration, change notices become your early warning system. For example, if a new foam supplier in Vietnam uses coal, your system alerts you to a 15% increase in carbon footprint.
To see the impact of PLM integration, look at this table:
| Material | Supplier | CO2e Impact (kg/unit) | Change Notice Trigger |
|---|---|---|---|
| Grip Tape | Supplier A | 2 | Yes |
| Foam | Supplier B | 3 | Yes |
| Textile | Supplier C | 1.5 | No |
In conclusion, PLM integration does more than just streamline your BOM. It makes sustainability a part of your design process. This way, you can avoid embarrassing moments when marketing calls a product sustainable but it’s not.
Reduction levers material swap design for life span modular repair energy use
We have big chances to lessen the environmental harm of sports gear. Material swaps can cut down our carbon footprint a lot. For example, using bio-based polyamide instead of virgin nylon reduces waste and our ecological impact. It’s like switching from a gas-guzzler to a hybrid, good for everyone!
Design for lifespan is another key area. Think of a helmet that lets you replace just the damaged part, not the whole thing. This saves resources and keeps the helmet in use longer. It’s great for the planet and your pocket.
Modular repair is also important. Imagine a bike with easy-to-change bearings that don’t need a PhD to swap out. This design promotes longer life and less waste, helping you keep your gear going.
Energy use is a big deal too. Moving production to places with renewable energy cuts down our material and process datasets impact. A study showed organic cotton uses 91% less water than regular cotton. But, it uses more land, showing sustainability is complex.
These strategies are real and can change sports equipment’s future. We must balance environmental goals with what people want. It’s like playing chess, needing to think ahead and make smart moves.
For more on sports and sustainability, read this article on sports biomechanics.
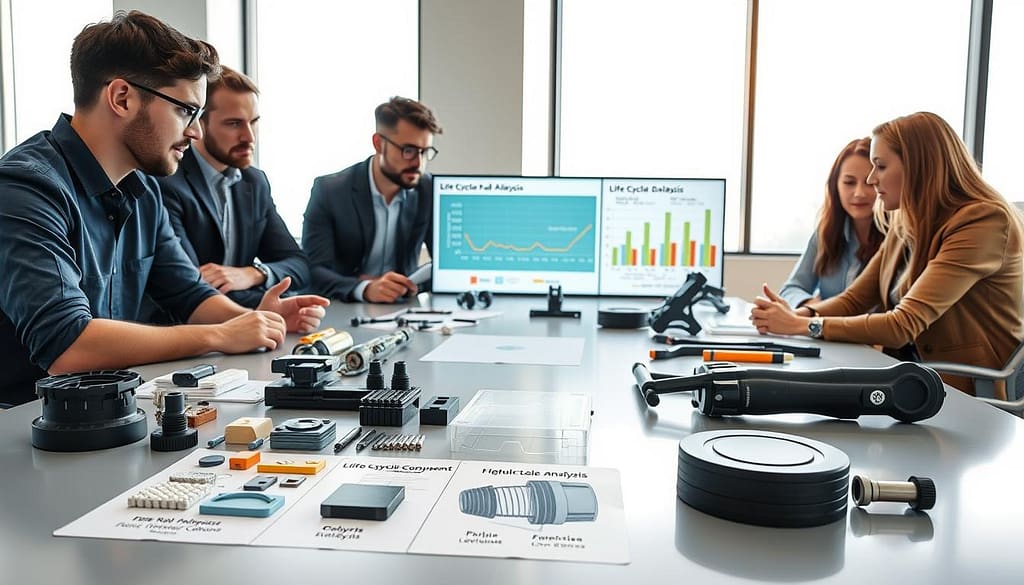
Communication EPD one pagers claims guardrails and audit trail
Making an Environmental Product Declaration (EPD) is like writing a love letter to the planet. It’s full of facts and charm. It’s key to share your findings well, as greenwashing is everywhere.
Let’s talk about claims guardrails. You don’t want to claim you’re “carbon neutral” but actually use tree-planting offsets. Focus on being transparent and honest. Your EPD is a summary of your environmental impact.
- CO2e per functional unit: Clearly outline your carbon emissions to keep the numbers honest.
- Breakdown of phases: Include a detailed look at the life cycle of your product.
- Visual aids: A bar chart can help the C-suite understand complex data at a glance.
Don’t forget the audit trail. An EPD without an audit trail is like a referee without a whistle—just noise. Your audit trail should show a clear path from your LCA software to the primary data. This way, you’re ready for any questions from journalists or regulators.
In the end, making an EPD is both science and storytelling. With a solid communication strategy, your claims will be credible and compelling. Transparency is key, and a well-made EPD can show your commitment to sustainability.
Governance review frequency thresholds for re certification and alerts
In sports equipment, governance is key, not just a formality. It’s what keeps your Life Cycle Assessment (LCA) up to date. Just as a sports team must adapt, your LCA needs to change with new data and situations.
Set a review frequency that fits your business needs. A common approach is every six months or when a big supplier changes their ways. This keeps your LCA current, like a sports car that stays ahead of the game.
Re-certification thresholds are also important. If CO2e per unit goes up by more than 5%, it’s time to redo the EPD creation process. Updating your LCA is a big deal, showing your dedication to being green.
Using your Product Lifecycle Management (PLM) system to send alerts can be a big help. Imagine your team getting a notification when a material’s carbon factor changes. This way, your LCA stays current, not stuck in the past like a fossil.
Creating a governance framework that’s quick to adapt keeps your data fresh and strong. Regular updates are not just good practice; they’re necessary for staying credible in a world that values openness.
Don’t let your LCA sit idle, used only for marketing. Foster a culture of ongoing improvement. This will make your sustainability efforts flourish.
Template workbook and example model walkthrough
Ready to dive into lifecycle analysis? The template workbook is your key to a smooth journey. It’s not just numbers; it’s a powerful tool that makes your Bill of Materials (BOM) come alive. It’s like having a personal coach, guiding you every step of the way.
With a simple dropdown menu, you can pick materials and see the CO2e impacts. Let’s take a bike helmet as our example. You’ll see how PLM integration gets the latest Environmental Product Declarations (EPDs) from suppliers. The calculations show the environmental impact of parts like the polycarbonate shell and EPS foam.
When you choose a recycled-content strap, the workbook notices the change. This hands-on guide turns theory into action. You’ll be creating EPDs like a pro. So, download the workbook and let’s make your LCA process as smooth as a high-performance racing bike.