
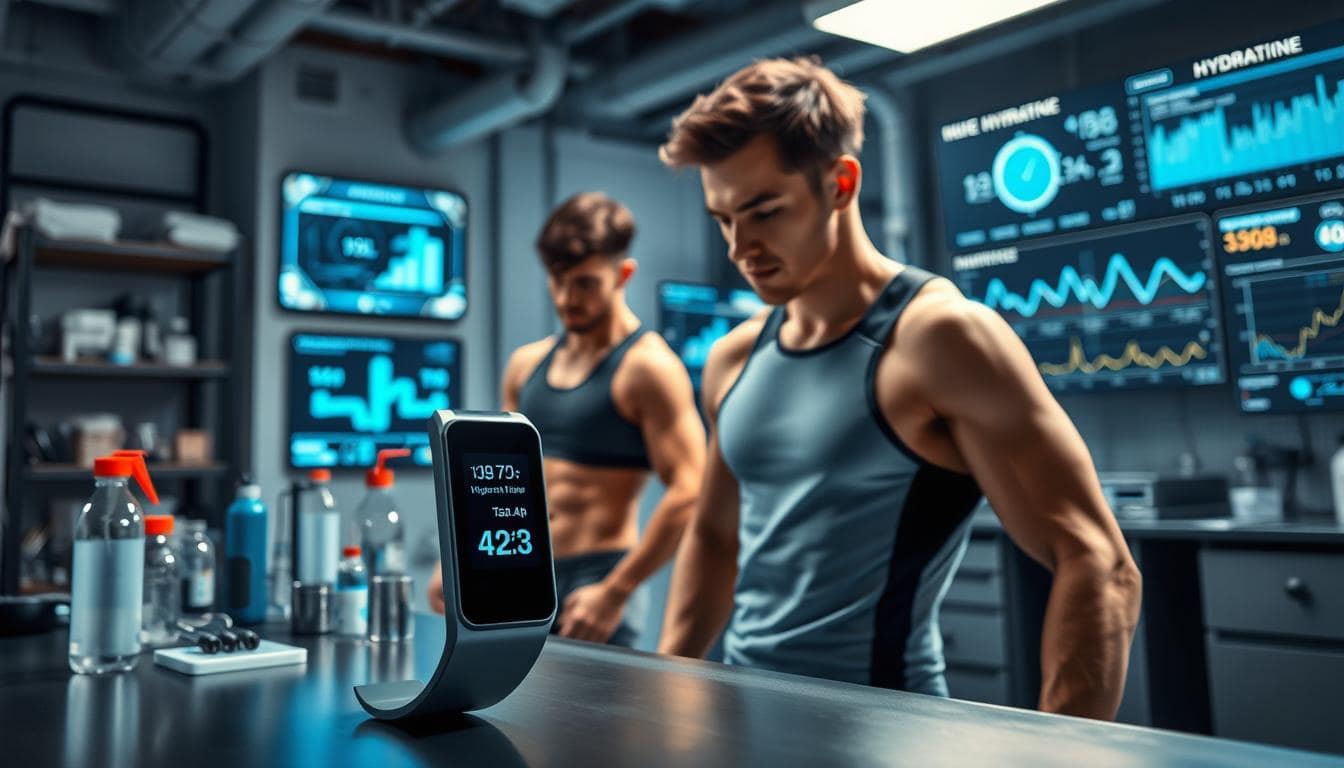
Think you know how to drink water? Think again. For years, we’ve followed a simple rule: drink eight glasses a day. But for athletes, this is like trying to drive a sports car with a map for a golf cart.
Your body is unique, not a standard model. The amount of sweat and sodium you lose can vary greatly. A one-size-fits-all plan is not only bad; it’s outdated.
We’re leaving old myths behind. Now, we focus on real-time data from your body. We’re using advanced sensors and smart algorithms. It’s not just about drinking water. It’s about listening to your body’s signals.
Hydration Science & Technology
The pilocarpine sweat test is like using a landline in a smartphone world—technically it works, but you’re missing the entire conversation. For decades, this borrowed medical diagnostic was our hydration gold standard. It gave us a number. A tidy, static data point plucked from a chemically stimulated patch of skin.
But here’s the rub. Your body during a brutal workout is not a calm, clinical forearm. The science, as Baker and colleagues pointed out in 2019, is clear. Sweat sodium concentration isn’t a fixed setting. It varies wildly with exercise intensity. It changes depending on which part of your body is sweating. Relying on a single, lab-generated snapshot is like planning your week’s weather based on one cloud.
This is where the plot twists. Modern sweat analysis technology isn’t interested in static images. It wants to direct a documentary. Enter the wearable microfluidic sensor, like the innovative hDrop. This isn’t a lab gadget. It’s a patch that sticks to your skin and listens. It conducts a live symphony of sodium and potassium ions as you move.
The shift is profound. We’ve moved from diagnosis to dialogue. Electrolyte monitoring becomes a dynamic conversation with your physiology, not a post-mortem report. You see a spike as you push into the red zone. You watch the trend line dip during recovery. This is real-time intelligence, not historical data.
Why does this matter for performance? A static test tells you you’re a “salty sweater.” The new tech shows you when and how that salinity changes under specific duress. It connects the dots between effort, environment, and loss. This is the foundation of true precision hydration.
The table below lays out the stark evolution from old-school assessment to modern, dynamic tracking:
| Method | Data Type | Real-Time? | Key Limitation |
|---|---|---|---|
| Pilocarpine Iontophoresis Test | Single-point electrolyte concentration | No | Measures chemically induced sweat, not exercise sweat |
| Bioimpedance Spectroscopy | Estimated total body water | No | Highly influenced by recent food/fluid intake |
| Wearable Microfluidic Sensor (e.g., hDrop) | Continuous sodium/potassium levels | Yes | Requires skin contact, single-use patches |
| Optical Skin Sensors | Relative hydration status via skin reflectance | Yes | Can be affected by skin tone and ambient light |
The old way asked, “What’s your number?” The new sweat analysis technology asks, “What’s your story?” It’s the difference between reading a biography and writing your own, one drop of sweat at a time. This isn’t just better electrolyte monitoring. It’s a fundamental upgrade in how we understand human performance.
So, we’ve traded the lab coat for a coaching headset. The science is no longer locked in a clinic. It’s on your skin, in your ear, and changing the game before your next lap is even done.
Sweat Analysis Systems
Modern microfluidic sensors are like tiny detectives, listening to what sweat has to say. They help us understand more than just feeling wet. It’s a big step forward.
Sweat is full of important information about our health. It tells us about our hydration and electrolyte levels. The challenge is to get this info in real time, without making athletes uncomfortable.
There are two main types of gadgets. One is the disposable biosensor patch, easy to use but short-lived. The other is the hDrop sensor, a reusable device that tracks your sweat continuously.

The hDrop sensor uses electrochemical sensors to measure electrolytes in sweat. But, it estimates sweat rate based on other data. This can sometimes make it seem like it’s not sure how much you sweat.
This technology is a huge leap forward. It’s like moving from a one-time weather check to having a live radar in your pocket. It helps you stay ahead of your hydration needs.
The technology behind this is fascinating. Microfluidic sensors collect and analyze tiny amounts of sweat. Electrochemical measurement turns this into data the device can understand. This allows for real-time composition analysis.
| Feature | Single-Use Biosensor Patches | Reusable Sensor Systems (e.g., hDrop) |
|---|---|---|
| Form Factor | Adhesive patch, worn once | Strap-on module, reusable |
| Measurement Method | Often colorimetric or basic electrochemistry | Advanced electrochemical sensors |
| Sweat Rate Data | May be inferred or absent | Calculated via estimation algorithms |
| Data Type | Snapshot, session-based | Continuous, real-time stream |
| Core Advantage | Convenience, low upfront cost | Long-term data tracking, reduced waste |
Choosing between the two depends on your needs. Disposable patches are great for quick, one-time use. Reusable systems are better for long-term tracking. The goal is to get precise hydration data.
We’re not just looking at sweat anymore. We want to know the exact electrolyte measurement and how it changes. That’s what these systems aim to provide.
Non-Invasive Monitoring Methods
New hydration sensors are listening to your body’s hydration signals. No one wants a blood draw during a marathon. The goal is to get data without any pain.
These tech tools speak different languages, trying to understand your body’s signals.
Bioimpedance spectroscopy is found in many smart scales. It sends a small electrical current through your body. Hydrated tissue lets it pass easily; dehydrated tissue blocks it. It’s like checking your body’s electrical grid.
Optical sensors use light to look into your skin. They check how water molecules absorb light. It’s like shining a flashlight on your finger.
Skin conductance measures how well your skin conducts electricity. It changes with sweat. More sweat means better conductance. It shows your body’s stress level, which is linked to fluid shifts.
Urine specific gravity (USG) analysis has become high-tech. It checks what your kidneys are excreting. Dark, concentrated urine means your body is holding onto water. It’s a sign of dehydration.
Saliva analysis is similar. Its osmolality increases when you’re dehydrated. Just spit in a cup to get a reading. It’s simple but not always easy during a workout.
Devices like the hDrop use a “Thumb Test.” You touch a sensor, and it measures sweat gland activity. It’s like your fingertips are telling you how hydrated you are.
So, how do you pick the right non-invasive method? The table below helps you decide.
| Method | How It Works | Primary Measurement | Best For | The Catch |
|---|---|---|---|---|
| Bioimpedance Spectroscopy | Sends a low-level electrical current through the body. | Total Body Water (Estimate) | Baseline assessments, daily tracking. | Can be influenced by recent food/water intake and body temperature. |
| Optical Sensors | Shines light (e.g., NIR) into skin to measure light absorption. | Tissue Hydration Level | Continuous, localized monitoring. | Accuracy can vary with skin pigmentation and sensor placement. |
| Skin Conductance | Measures the electrical conductivity of the skin’s surface. | Sweat Secretion & Nervous System Activity | Real-time stress/effort correlation. | Not a direct measure of systemic hydration. |
| Urine Analysis (USG) | Analyzes the concentration of particles in a urine sample. | Kidney Concentration Effort | Post-event or morning hydration status. | Lagging indicator; impractical during activity. |
| Saliva Osmolality | Measures the concentration of particles in saliva. | Mucosal Hydration State | Quick, in-field checks. | Can be affected by food, drink, and oral hygiene. |
Methods range from general alerts to specific readings. Some methods give a broad warning (“You’re dehydrated!”). Others, like advanced sweat hydration sensors, provide detailed information (“You’ve lost 800mg of sodium this hour”).
The right tool depends on what you need. Do you want a general trend or a specific reading? The answer will guide you to the right non-invasive method.
Real-Time Feedback Systems
A sensor reading is just a fact. But a real-time feedback system is a conversation with your body. It’s like getting a personal storm warning, telling you when to seek shelter.
Raw data is hard to understand. “1326 mg/L of sodium” means nothing to athletes in the middle of a race. Modern systems make sense of it all, turning numbers into clear messages.
From Data Stream to Narrative
The hDrop app shows more than just sweat rate. It breaks it down into Sweat Zones: Concentrated, Target, and Diluted. A flashing “Concentrated” zone with a vibration is a hydration alert you can’t ignore.
This system tells you a story: “You’re losing sodium fast. Drink electrolyte mix now, or performance crashes in 40 minutes.”
This is a big leap from looking back to proactive coaching. The feedback loop is closing in real-time.
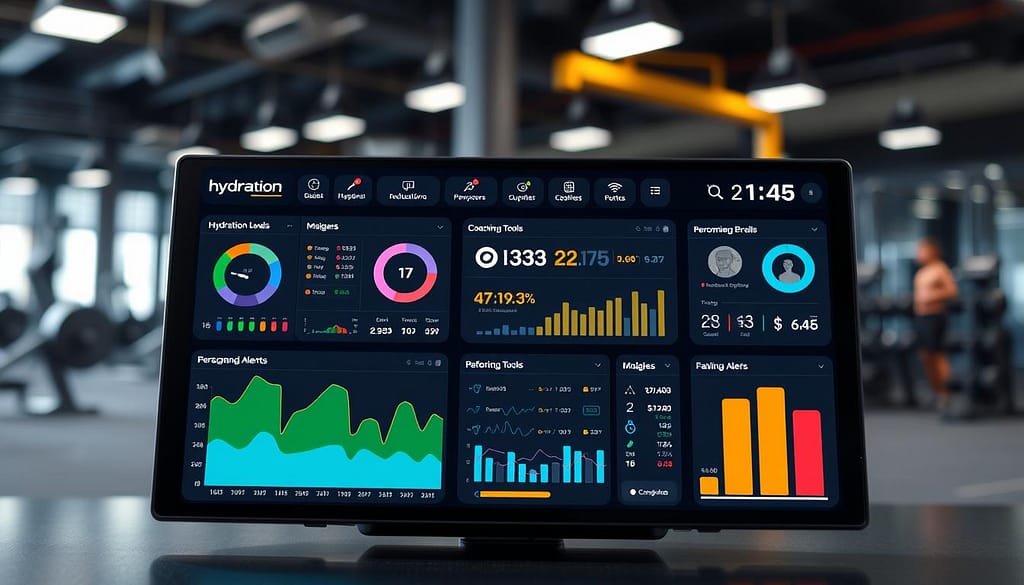
After your session, these systems give you a detailed summary. They connect your sweat, effort, and results. This creates a powerful performance dashboard, showing more than just mileage or heart rate.
The Integration Dream
The real power comes from coaching integration. Your hydration sensor shouldn’t be alone. Links with Garmin and Hammerhead bike computers are the first steps. Soon, your sweat data will influence your virtual training load.
The dream is a seamless, closed-loop system. Your patch talks to your bike computer, which then tells your smart bottle to dispense the right amount of electrolyte mix. We’re building the framework for this now. This level of advanced sport monitoring is changing how we interact with our bodies.
These systems give you personalized recommendations. They learn your baselines and adapt. The advice becomes specific, like “based on your current sweat sodium concentration and the rising heat index, consume 300ml of your specific mix now”.
| Feedback Type | What It Tells You | Typical Action | Example System |
|---|---|---|---|
| Sweat Zone Alert | Whether your sweat is too concentrated, ideal, or too diluted based on real-time sodium. | Adjust drink type (water vs. electrolyte mix) immediately. | hDrop App with connected sensor. |
| Electrolyte Loss Rate | How many milligrams of sodium you are losing per hour. | Calculate and prepare a precise replenishment strategy for your session. | Advanced sweat analytics platforms. |
| Predictive Bonk Alert | A forecast of performance decline due to fluid/electrolyte imbalance. | Pre-emptively take in nutrition or fluid before the crash happens. | Integrated AI models in coaching software. |
| Unified Session Summary | Correlates hydration data with heart rate, power output, and environmental conditions. | Informs long-term training adjustments and race-day planning. | Platforms integrating with Garmin/Strava ecosystems. |
This isn’t just about avoiding dehydration. It’s about making every minute of exertion count. By turning physiological data into actionable intelligence, these feedback systems become a co-pilot. They show how wearable technology in sports equipment is moving from passive tracking to active guidance.
The era of guessing is over. The conversation with your body has begun.
Environmental Factor Integration
The latest leap in athletic monitoring isn’t a better sweat sensor; it’s a weather station fused to your skin. For decades, we measured fluid loss as if the body performed in a sterile, climate-controlled bubble. That’s a fantasy. Your workout happens in the real world—on sun-baked asphalt, in muggy gyms, or under a thin, dry mountain sky.
Ignoring this context is the cardinal sin of old-school data. It’s like reviewing a film based on a single frame. Knowing your sodium concentration is useless if you don’t know whether that sweat was spurred by a brutal interval or by the sauna-like humidity clinging to you. Understanding the why is the core of any modern performance hydration systems.
Consider the data. Rigorous testing protocols, like those used to validate new tech, explicitly run the gamut: temperatures from a brisk 59°F (15°C) to a brutal 107.6°F (42°C), with humidity swinging from 35% to 81%. That’s not an academic exercise. It’s a recognition that sweat rate isn’t a fixed equation. A device like the hDrop measures “near-skin temperature” precisely because your dermal climate is the engine driving loss.
This is where advanced performance hydration systems separate from mere gadgets. They integrate miniature thermometers and hygrometers. They’re not just listening to your body’s conversation; they’re recording the room’s temperature and the air’s moisture. Was it the effort or the environment? Now, you get an answer.
The logic is beautifully simple yet profound. By weaving in real-time data on exercise intensity, these systems perform a live calculation. They merge personal exertion with ambient stress to create a true heat index for you. The most sophisticated performance hydration systems now ask: “Is this sweat rate normal for this heart rate, in this heat, at this humidity?” If not, the alert isn’t just “drink more.” It’s “the environment is winning; adjust your effort or cooling strategy.”
This integration is the magic. It turns raw data—milligrams of sodium, milliliters of sweat—into actionable intelligence. It provides the narrative behind the numbers. A sensor that knows the weather on your skin understands your performance in a way a lab device never could. It’s the final piece that transforms a simple performance hydration systems into a genuine performance partner.
Personalization Algorithms
Today’s top hydration systems do more than just track sweat. They learn about your body over time. The sensor gathers data, but the algorithm makes sense of it. This turns raw numbers into a customized playbook for your body.
Not all algorithms are the same. Some are simple, like a basic calculator. You input your details, and it gives a generic fluid intake number. Tools like the Fuel & Hydration Planner use this static decision tree logic. It’s useful but doesn’t learn or remember you.
The real breakthrough is in the adaptive algorithm. It’s like the difference between reading a speech and having a real conversation. Systems like hDrop show this. They create a personalised sweat sodium profile over time. Your first run gives a clue, and your tenth run in different conditions reveals a pattern. This is how a true individual baseline is set.
Once it knows your baseline, the algorithm looks for adaptation patterns. Does your sweat sodium drop as you get used to the heat? How does your rate change with intensity? This learning lets the system predict your needs for races in new climates, because it understands how you react to stress.
The ultimate goal is a customized protocol that changes. It’s not just a static plan. It’s a dynamic set of recommendations that adjust as you sweat. The algorithm sets a personal Target Zone for hydration, getting smarter and more personal with each use. This is precision hydration that knows the science and knows you.
Technology Validation
Forget the flashy marketing. The true test of any hydration monitor happens not on the wrist, but in the lab and on the track.
This is where we separate the hype from the hydrolysis. Anyone can slap a sensor on a band and call it revolutionary. The real question is a simple one: does it tell the truth?
Validation is the unglamorous, meticulous courtroom where claims meet evidence. It’s a multi-stage process involving accuracy assessment against a gold standard, clinical correlation with physiological outcomes, rigorous field testing under real-world conditions, and the slow march toward regulatory approval. Without this foundation, you’re just wearing a very expensive mood ring.
Our lab took a popular device, the hDrop, to task. The resulting report is a masterclass in analytical nuance. The device isn’t perfectly accurate—what in this beautifully messy world of biology is? But we now know its specific biases.
The table below lays out the hard numbers from a controlled validation, comparing the hDrop to the established gold standards: pre- and post-exercise nude body mass for sweat rate, and the sophisticated PF&H Sweat Analyzer for sodium concentration.
| Metric | hDrop Measurement | Gold Standard | Calculated Bias |
|---|---|---|---|
| Sweat Rate | Consistently Lower | Pre/Post Nude Body Mass | Underestimates by 0.58 L/hour |
| Sodium Concentration | Consistently Higher | PF&H Sweat Analyzer | Overestimates by 177 mg/L |
| Key Implication | Heavy sweaters (e.g., marathoners) receive significantly lowballed sweat loss data, a major red flag for hydration strategy. | ||
Knowing these biases is everything. A device that consistently lowballs sweat rate for heavy sweaters isn’t just “a little off.” It’s providing data that could lead an athlete to under-drink during a marathon. That’s the difference between a personal best and a medical tent.
This critical work also exposes the limitations of the old guard. The traditional, single-site, static sweat test faces its scientific reckoning here. Peer-reviewed research, including the Baker et al. study, demonstrates the fundamental flaw of assuming one patch of sweat tells the whole story. Dynamic, real-time monitoring was born from this very evidence.
So, the race isn’t just to market. It’s to validation in the pages of the Journal of Applied Physiology. The next generation of tech must compete not on features, but on scientific credibility. Regulatory approval from bodies like the FDA will be the final seal, but the first and most important stamp comes from rigorous, transparent field testing and clinical correlation. In the end, trust is the most valuable metric of all.
Professional Implementation
The true test of a monitoring system isn’t in a lab. It’s on the field during the final quarter. Professional implementation turns a cool gadget into a vital tool. It integrates data into coaching, medical, and operational team protocols.
Data alone is just noise. But on a dashboard, it becomes a powerful tool. Imagine tracking athletes’ hydration, sweat, and electrolytes in real-time. This isn’t fantasy; it’s the future of elite sports.
This new approach changes coaching workflows. Should a dehydration alert go to the athlete, coach, or nutritionist? It depends on the sport and situation. This data must blend with training and diet plans. It turns hydration into a strategic asset.
For medical teams, medical integration is key to prevention. Continuous monitoring warns of health issues early. It helps prevent heat illness and hyponatremia. In military or remote settings, it lets medics watch entire teams from a command center.
Hydration strategies vary for athletes. Individual monitoring tailors plans for each athlete. Team protocols focus on group safety and logistics. The “Precision Performance Lab” model offers the evidence-based guidance needed.
Successful professional implementation updates the team’s playbook. It requires new skills and software. The goal is to make the technology invisible, focusing on better decision-making. This shift is part of the sensor technology landscape, showing innovation often lies in how we use data.
Design Engineering Challenges
The dream of perfect hydration monitoring meets reality’s hurdles. You can create the most accurate sensor, but if it’s big, eats a lot of power, and breaks easily, it’s useless. The real challenge is making something genius seem simple.
Making sensors tiny is like a tiny dance. Engineers put complex designs on chips as small as a fingernail. They also have to figure out how to keep it running for days without needing a new battery. The hDrop wearable, for example, lasts up to 120 hours on a single charge.
Next, they face the test of sweat, rain, and crashes. The device must be waterproof and tough. It also needs to be comfortable to wear. A device that’s too tight or uncomfortable is a failure.
Lastly, making the tech affordable is key. It must be made with advanced materials but at a price people can afford. The hDrop aims to do this with its reusable design and £199 price. It’s not about making a fancy gadget. It’s about creating something useful.
The biggest win in design engineering is making the tech invisible. The best tech works so well that you forget it’s there. This is how you truly prevent dehydration. When the tech disappears, athletes can focus on their game.