

Remember when coaching was more art than science? It was a world of gut instinct, generic plans, and crossed fingers.
That old model—call it Traditional Training—was reactive. It relied on intuition. Today, that approach feels as outdated as a flip phone.
We’ve entered the era of AI-Powered Training. It’s data-driven, personalized, and shockingly predictive. This isn’t just an upgrade. It’s a revolution.
The goal now is to build a digital twin of a competitor’s entire being. We’re moving from reading tea leaves to decoding the human genome of sport.
Experts predict that by 2028, artificial intelligence will change games forever. It will make everything smarter. The landscape is shifting beneath our feet.
So, here’s the real question. Are you playing checkers while the competition masters 4D chess? Let’s break down the new rules.
Performance Metrics Framework
Forget counting laps; the real game-changer is measuring an athlete’s adaptive capacity through a structured performance metrics framework. In the corporate world, KPIs are often about hitting arbitrary targets. In sports, they’re about uncovering biological truth. This framework isn’t a spreadsheet. It’s the architectural blueprint for turning chaotic data into a coherent, actionable story of human potentials.
Without it, you’re navigating a storm with a broken compass. You have data, sure. But is it telling you the right story? A proper framework answers four critical questions: What are we measuring? How do we measure it consistently? What does the measurement mean? And where are we headed? Let’s break it down.
KPI Definition: The Art of Asking the Right Question
Defining Key Performance Indicators in sports is less about corporate buzzwords and more about biological and tactical truth-telling. Is your key metric raw squat weight, or the resilience of the patellar tendon under that load? The former is easy to ego-lift. The latter is what keeps an athlete on the field.
Effective KPIs in sports performance analytics fall into two camps: outcome and driver. Outcome KPIs are the finish line—race time, points scored. Driver KPIs are the engine—sleep quality, heart rate variability (HRV), stress balance. The magic happens when you connect them. The table below shows how modern frameworks categorize and quantify this impact.
| Metric Category | Specific Metric | Typical Impact Range |
|---|---|---|
| Training Outcome | Training Efficiency | +20% to +30% |
| Health & Safety | Injury Reduction | -30% to -50% |
| Recovery | Recovery Quality | +25% to +40% |
| Competitive Edge | Peak Performance | +5% to +15% |
| Health Metrics | Sleep Quality, HRV Trends, Stress Balance | Foundational (No Range) |
As the data shows, the right performance metrics focus on sustainable excellence, not just explosive moments. This aligns with the philosophy of organizations like TSRL, which prioritize “Performance – Prioritizing excellence and optimal outcomes for athletes.” It’s a shift from measuring work to measuring worth.
Measurement Standardization: The Unsung Hero of Data Harmony
Here’s the dirty secret of wearable tech: without standardization, data from a Whoop, a Garmin, and a Polar is just a noisy, conflicting choir. Each device sings its own tune. Was the athlete’s heart rate 165 bpm or 158? Did they get 7.5 hours of sleep or 6.8?
Standardization creates a common language. It involves strict protocols for how, when, and where data is collected. This turns subjective guesswork into objective fact. It’s the difference between an anecdote and evidence.
Comparative Benchmarking: Context is Everything
Benchmarking isn’t about creating clones. It’s about contextualizing. An athlete’s data point is meaningless in a vacuum. Is a vertical jump of 28 inches good? The answer requires three layers of comparison:
- Against Self: Is it better than their baseline last month?
- Against Peers: How does it stack up in their position group or league?
- Against the Ideal: What is the biomechanical “gold standard” for their sport?
This triple-lens view prevents athletes from chasing generic, internet-fad goals and instead directs them toward personalized, relevant targets.
Progress Tracking: Writing the Season’s Narrative in Data
Progress tracking is the narrative arc of the entire season. It’s written not in press clippings, but in the silent, relentless flow of validated metrics. This is where the framework pays off.
It moves the conversation from “I feel pretty good” to “My parasympathetic nervous system reactivity has improved by 22%, indicating I am primed for a personal best.” It transforms hope into a forecast. By visualizing trends in driver KPIs, coaches can see the storm coming—overtraining, illness, mental fatigue—and adjust the training load before performance drops.
In essence, a robust performance metrics framework is the intellectual scaffolding that turns data into wisdom. It replaces brilliant measurements of the wrong things with precise measurements of the right things. And in the margin-obsessed world of elite sports, that wisdom isn’t just power. It’s victory.
Multi-Source Data Integration
Forget data silos; the future of athlete data analysis is a mix of all data types. Heart rate data meets GPS coordinates. Sleep scores and hydration levels have their say. It’s in these conversations that we find performance truths.
Our job is not to build taller silos. Instead, we’re the ultimate party host. We make sure all data flows well together.
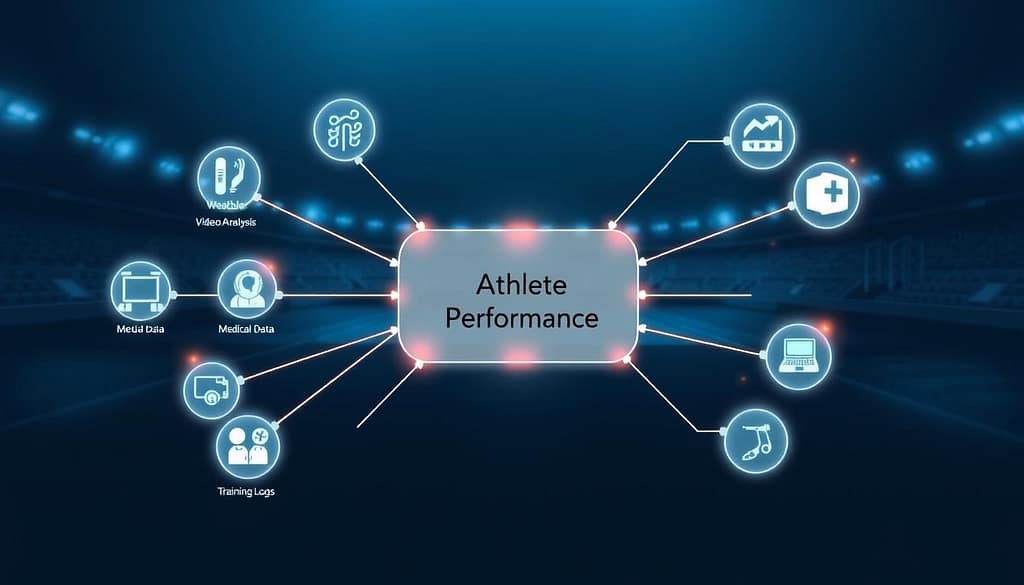
Wearables: The 24/7 Whisper
These devices are the foundation of our data. They provide constant, often subconscious, biometric data. A Whoop ring focuses on recovery metrics. A Garmin watch updates training load.
Polar straps capture heart rate with precision. Oura quietly builds sleep quality scores. For team sport athletes, it’s about using the right tool for each physiological signal.
Video Analysis: The Unblinking Eye
While wearables whisper what is happening internally, video analysis shows how it’s happening externally. It’s the stark, visual proof. Did that knee valgus at 87% of max load during the last set? Video knows.
Is the swimmer’s hand entry angle five degrees off optimal? The camera doesn’t lie. This layer transforms subjective coaching eye into objective, frame-by-frame biomechanical data.
Environmental Sensors: The Context Providers
Data never exists in a vacuum. A 100-meter sprint in Oslo feels different in Doha. Environmental sensors add the “where” to the “what” and “how.”
They track ambient temperature, humidity, altitude, and playing surface hardness. This context is everything. A spike in heart rate could be due to effort—or the 95-degree heat and 80% humidity.
Medical Data: The Historical Record
This is the athlete’s biography written in scans, screens, and treatment notes. Integrating historical medical data—past MCL strains, baseline concussion tests, bloodwork trends—provides the “why” behind current limitations. It turns a simple data point into a narrative.
A slight asymmetry in force production isn’t just a number; it’s a clue that points back to an old injury. This historical layer is essential for true, holistic athlete data analysis and effective injury prevention strategies.
Training Logs: The Intentional Blueprint
Training logs are the plan versus the reality. The coach’s training log (yes, even the handwritten scrawl) digitized into the system. This is the prescribed intent: planned volume, intensity, and focus.
By integrating this with the actual data from wearables and video, we see the gap. Was the session executed as designed? Did the athlete’s body respond as expected? This feedback loop closes the circle, transforming data from a rearview mirror into a steering wheel for future training.
So, how do these five party guests interact? The table below breaks down their roles in the integrated system:
| Data Source | Primary Data Type | Key Integration Value |
|---|---|---|
| Wearables (Whoop, Garmin, Polar, Oura) | Continuous Biometrics (HRV, Sleep, Load) | Provides the physiological baseline and real-time strain measurement. |
| Video Analysis | Biomechanical & Movement | Offers visual, objective truth for technique and form correlation. |
| Environmental Sensors | Contextual (Temp, Humidity, Altitude) | Explains external factors influencing performance metrics. |
| Medical Data | Historical Health & Injury | Informs risk profiles and explains physiological anomalies. |
| Training Logs | Prescriptive Intent | Measures execution against plan, enabling adaptive programming. |
The power isn’t in any single row of that table. The power is in the connections between them. It’s the algorithm that notices a slight dip in morning HRV (wearable), correlates it with a subtle change in knee tracking on video, cross-references an old injury in the medical file, and adjusts today’s session in the training log—all before the athlete finishes their breakfast. That’s the symphony. That’s integrated athlete data analysis in action.
Real-Time Processing Systems
Imagine a coach trying to make a halftime adjustment using stats from last week’s game. That’s the problem with batch processing in sports. Data in sports is like a ticking clock, losing value fast.
Real-time processing systems are key in sports data science. They turn raw data into quick, useful insights.
Forget the post-mortem report. We’re talking about a live diagnosis during the operation.
Stream Processing: Taming the Firehose
During a game or intense training, data flows non-stop. It includes heart rate, GPS location, and more. Batch processing is like collecting rainwater to analyze later.
Stream processing is drinking from the firehose. Systems like Apache Kafka or AWS Kinesis handle this data flow. They let us ask questions of the data as it happens.
Edge Computing: The Intelligence on the Sideline
Sending data to a cloud server for analysis is slow. Edge computing brings the brain closer to the action. It processes data on devices like smartwatches or laptops.
This approach is fast, like a neural synapse. It’s the difference between a warning and an autopsy.
Latency Optimization: The Race Against Physiology
In sports, latency is a big deal. It’s a challenge to optimize it. Can we detect a pitcher’s rotator cuff loading dangerously before the next throw?
Shaving milliseconds off data processing can prevent injuries. This involves efficient algorithms and strategically placed edge servers.
Scalability Requirements: From One to a Legion
A system for one athlete won’t work for a whole team. Real-time systems must scale. They handle data from many athletes at once, without slowing down.
This requires elastic cloud resources and efficient load balancing. Your data pipeline must be as fit as your athletes.
Alert Systems: The Canary in the Coal Mine
Alert systems are key in real-time systems. They send warnings based on data. “Athlete 23: Heart rate variability critically low.” They turn data into urgent messages.
This isn’t just number-crunching. It’s about building digital reflexes that match the game’s speed. When done right, it feels like a sixth sense for coaches.
Machine Learning Applications
Today’s coaches use machine learning models to predict performance with great accuracy. This marks a shift from just recording past events to planning for the future. Sports data science graduates now use data to predict what will happen next.
Machine learning doesn’t just process data. It learns, adapts, and creates new strategies. It uses data points to compose game plans.

Performance Prediction: The Art of the Possible
Performance prediction isn’t about guessing. It’s about analyzing an athlete’s physiology against millions of data points. Modern models look at training load, sleep, and biochemical markers.
They answer questions we used to guess at. Will a pitcher’s velocity drop in the 7th inning? Is a runner ready for a personal best next week? These systems predict adaptation and fatigue, giving coaches a probabilistic playbook.
This turns guesses into calculated risks. That’s a big change.
Pattern Recognition: Finding the Signal in the Noise
Raw athletic data is chaotic. Pattern recognition algorithms are the filters. They find the subtle signs of success or failure.
Maybe a specific sequence of joint angles always precedes a powerful golf swing. Or a heart rate variability pattern signals optimal recovery. Machine learning spots these repetitive motifs that define elite performance.
It’s like teaching a computer to recognize an athlete’s unique fingerprint.
Anomaly Detection: The Unsentimental Watchdog
Anomaly detection is the system’s immune response. It knows what “normal” looks like for an athlete and alerts when things are “off.”
Did a soccer player’s deceleration curve suddenly change during a drill? Has a swimmer’s stroke rate become erratic? The model flags it instantly. This isn’t about criticism. It’s about early warning.
This unsentimental watchdog is often the first line of defense against overtraining and injury. It cares about the data, not feelings.
Personalization: The End of One-Size-Fits-All
Personalization is the holy grail of modern training. Machine learning demolishes generic plans. It builds a regimen tailored to an individual’s genotype, phenotype, and real-time response.
Nutrition, sleep interventions, drill intensity—everything adapts. The athlete becomes their own control group. This is applied sports data science at its most powerful.
It acknowledges a simple truth: no two bodies are the same. Why should their training be?
Ultimately, these machine learning applications transform athletes from subjects of observation into partners in optimization. The data tells a story. The AI helps write the next, better chapter.
Visualization & Reporting
The true test of any analytics platform isn’t its computational power. It’s how quickly it makes a coach say ‘Aha!’. Data trapped in a database is like a prisoner. Visualization is the jailbreak.
It’s where complex algorithms meet human intuition. Here, athletic performance software proves its worth. It’s not just about being powerful, but being profoundly usable.
Think of it as the difference between reading a film’s script and watching the final cut. The raw data is the script—full of promise but lacking impact. Visualization is the directed, scored, and edited movie that stirs you.
It’s the translation layer TSRL’s mission hinges on. Turning numbers into narratives and metrics into momentum.
Dashboard Design: Cognitive Ergonomics for the Win
A great dashboard is a form of cognitive ergonomics. It presents the five most critical things a coach needs to know before their first cup of coffee. All at a single glance. Clutter is the enemy. Every chart, gauge, and KPI must earn its real estate.
Platforms like Athletica and Today’s Plan excel here. They understand that different roles need different dashboards. The design principle is simple: show, don’t tell. A red-amber-green readiness score is instantly understood. A trending arrow next to a power output metric tells a story of adaptation or stagnation.
Interactive Analytics: From the 30,000-Foot View to the Blade of Grass
Static reports are history books. Interactive analytics are live documentaries. This feature allows you to start with a team-level stat—like red-zone efficiency—and drill down. Click. Now you see the unit’s performance. Click again. You’re looking at an individual player’s route timing on a specific play.
This self-service exploration empowers the coaching staff. They can ask their own questions of the data without waiting for a data scientist. It turns the platform from a reporting tool into a discovery engine. Why did possession time drop in the third quarter? An interactive heatmap of player movement might just have the answer.
Mobile Accessibility: Insights in Your Pocket, Not Just Your Office
The modern game doesn’t wait for a desktop computer. Mobile accessibility means the strength coach can check an athlete’s readiness score from the gym floor. The trainer can review hydration data from the sideline. And the athlete can see their sleep performance on their phone while eating breakfast.
This isn’t about shrinking a website. It’s about designing for context. Mobile interfaces prioritize alerts, key daily metrics, and simple input. They recognize that the most important data interactions often happen far from a desk.
Coach Interfaces: Built for Decisions, Not Contemplation
A coach’s interface must be built for decision-making under pressure, not for academic contemplation. Menus should be shallow. Actions should be obvious. Need to adjust tomorrow’s training load based on today’s fatigue metrics? That function should be one tap away from the dashboard.
The best athletic performance software acts like a skilled assistant. It surfaces the anomaly, highlights the trend, and suggests the action. It filters out the noise so the signal—the insight that changes a plan—is impossible to miss.
Athlete Portals: Empowerment Through Personal Storytelling
For the athlete, a portal is about engagement and ownership. Abstract data becomes a story about their journey. It answers the question, “What does this mean for me?”. Seeing a graph of their own progress is motivating. Understanding how last night’s sleep score connects to today’s sprint time is educational.
This portal turns the athlete from a data subject into an active participant. They can log subjective wellness, view their prescribed workouts, and track personal goals. It’s the feedback loop that closes the circle between measurement and meaning.
| Visualization Component | Primary User | Key Design Principle | Example Platform Focus |
|---|---|---|---|
| Executive Dashboard | Head Coach / Performance Director | At-a-glance organizational health | Catapult (Team Overview metrics) |
| Interactive Drill-Down | Sports Scientist / Analyst | Self-service root-cause analysis | Tableau/Sportlogiq integrated systems |
| Mobile Readiness View | Athlete & Support Staff | Context-aware, key metrics only | Athletica app |
| Coach Decision Panel | Technical & Tactical Coaches | Action-oriented, minimal clicks | Today’s Plan session planner |
| Athlete Engagement Portal | Athlete | Personalized, narrative-driven | Whoop / Garmin Connect ecosystem |
In the end, visualization and reporting are about respect. Respect for the coach’s time, the athlete’s journey, and the intelligence of the user. The most advanced machine learning model is a parlor trick if its output is confusing. But a simple, well-designed chart can change a season. That’s the alchemy of great athletic performance software: turning leaden data into golden insight.
Data Quality Management
Data quality management is key to making your analytics platform shine. It’s like the backstage crew that makes sure everything goes smoothly. Even with the best dashboards and algorithms, bad data can ruin everything.
In athlete data analysis, it’s not just about clean spreadsheets. It’s about making sure every training decision is safe and right.
Validation Protocols
Before data gets used, it must pass a test. Validation protocols check if the data is real and accurate. They ask tough questions like:
- Plausibility Checks: Is the value within normal limits?
- Source Verification: Did it come from a trusted device?
- Contextual Alignment: Does the data match what’s happening?
Without this, you’re just looking at noise, not real performance.
Error Detection
Errors can sneak in and mess up your data. They might be small or big, but they can change everything. Error detection algorithms find these problems early.
They look for things like sudden spikes or dead sensors. This way, you can fix problems before they cause big issues.
Missing Data Handling
What to do when data is missing is a big question. If an athlete’s GPS pod stops working, do you ignore it or fill in the gaps? Each choice has its own problems.
The best thing is to have clear rules. Decide what’s okay to ignore and what’s not. Sometimes, saying “we don’t know” is the best answer.
Calibration Procedures
Calibration keeps your data consistent. It’s like regular maintenance for your tools. Things like environmental sensors and force plates need to be checked often.
This ensures your data is reliable. It turns guesses into facts.
The Quality Culture
Quality is more than just rules; it’s a way of thinking. It’s about choosing quality over quantity. It’s about focusing on what really matters.
This culture values accuracy. It knows that bad data can lead to bad decisions. The real value of analytics is in the quality of your data, not just how much you have.
Privacy & Security Considerations
We’ve created the ultimate performance surveillance system. Now, we must protect it with a strong defense. The data from athletes is more than just numbers. It shows their heart rate, sleep, and location.
Handling this data lightly is a betrayal. It’s a breach of trust. So, we have five key principles to protect it.
Data Encryption: The Unbreakable Cipher
Encryption is not just a policy. It’s a moral duty. It keeps data safe, whether it’s at rest or in transit. This ensures athletes’ personal data is secure.
Strong encryption is like a promise. It says, “Your health data is safe with us.”
Access Control: The Need-to-Know Philosophy
Who gets to see athletes’ data? Not everyone. Modern systems follow the principle of least privilege. This means only authorized people can access data.
It’s like a zero-trust architecture. Every access is checked. This makes data safe and secure.
Consent Management: Beyond the EULA Panic
Getting consent isn’t just about signing a form. It’s about being open and ongoing. Athletes should know what data is collected and why.
They should have control over their data. This makes them partners, not just subjects.
Regulatory Compliance: The Legal Basement
Laws like HIPAA and GDPR are the minimum. They’re not just about avoiding fines. Compliance is about building a solid process.
It’s like a structural report for your data fortress. It proves you take privacy seriously.
Ethical: The Highest Ceiling
Using data ethically is the real challenge. Will it help athletes or harm them? Technology should bridge gaps, not widen them.
Our goal is to extend careers, not end them. Building trust is key. The most valuable KPI might be the faith athletes have in your platform.
Professional Implementation
Imagine buying a Formula 1 car and trying to drive it on a dirt road without changing your team’s pit stop procedures. That’s the challenge of professional implementation. The fanciest training analytics platform is useless if it’s not part of daily operations. Success is about trust and workflows, not just processing data.
The Art of Coaching Integration
This step is the hardest. It needs humility from data scientists and curiosity from coaches. The goal is to support decisions, not make them. Your platform should suggest possibilities, not command actions. It’s about combining data insights with real experience.
Best practices include an “expert override” function. The coach should always have the last word. This isn’t a weakness; it’s the system’s strength. It builds trust for using the technology.
Team Workflows
Data collection and review should be easy, like pulling on a sock. It means changing existing routines. Who inputs data? When is it reviewed? The TSRL framework helps prepare teams for these changes.
Seamless integration turns resistance into routine. It makes data flow so natural that its absence is noticed.
This is where data meets human insight. A good system offers clear, actionable insights, not just raw data. It might show an athlete’s readiness score or flag a technique issue. The platform provides the “what,” while humans decide the “why” and “how.”
Dynamic Training Modification
This is where training analytics show their worth. The model might suggest changes, like swapping high-intensity intervals for technical skill work.
These changes are based on evidence and are tailored to each athlete. It makes the training plan dynamic and effective.
Performance: The Ultimate Metric
All efforts aim for one goal: performance. The true value is seen in sharper skills, better race times, and more wins. It’s the blend of algorithm and instinct that shows up in results.
To succeed, a phased approach is essential. The following table outlines a proven roadmap for professional implementation.
| Phase | Primary Focus | Key Activities | Success Metric |
|---|---|---|---|
| 1. Foundation & Alignment | Building buy-in and defining goals. | Stakeholder workshops, process mapping, defining key use cases for training analytics. | Coaching staff can articulate the “why” behind the platform. |
| 2. Integration & Training | Weaving tech into daily routines. | Customizing dashboards for coach/athlete views, hands-on training sessions, establishing data entry protocols. | Data collection occurs without prompting or complaint. |
| 3. Decision Support Activation | Turning data into actionable insights. | Reviewing automated reports in team meetings, piloting model suggestions for training modification. | Coaches regularly cite platform data when explaining a training decision. |
| 4. Optimization & Scale | Refining the system and expanding use. | Analyzing feedback, tweaking algorithms, expanding analytics to new athlete groups or performance facets. | The system is considered a core, indispensable part of the performance operation. |
The goal isn’t to create a team of data scientists. It’s to empower coaches and athletes with data. That’s the final, and most important, implementation phase of all.
ROI & Effectiveness Measurement
So, what’s the final score? In today’s sports world, the return on investment is different. It’s not just about saving money from avoiding injuries. It’s about the long-term benefits of small improvements.
performance improvements
Real training analytics platforms really make a difference. They can boost training quality by 25-35%. Athletes can see their results improve by 10-20%. And, their prime years can be extended by 2-5 years.
This is not just a small change. It’s a major transformation of an athlete’s abilities.
injury reduction
Injuries can end seasons and careers. Advanced analytics help athletes stay healthy. They identify risks before they become serious problems.
Preventing injuries is not just a bonus. It’s a clear victory.
training efficiency
Smart training analytics get more out of less. They focus on precision, not just doing more. This way, athletes can reach their peak without overdoing it.
This approach is key to lasting success.
competitive advantages
The biggest advantage is time. Time saved from making wrong guesses. Time to make better decisions than opponents. As AI changes sports, this data-driven edge is essential.
The future of sports is not just about being faster or stronger. It’s about being smarter.
The proof is in the platform. It turns hopes into a focused path to excellence. That’s the real return on investment.